Definition
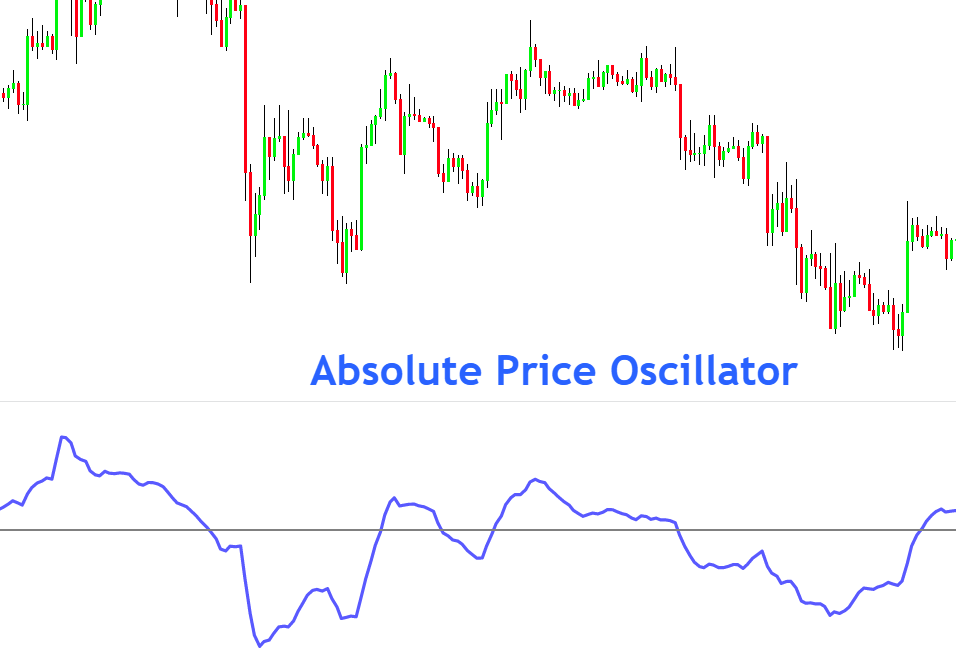
An absolute Price Oscillator is a technical indicator that shows the difference between the short period exponential moving average and slow period exponential moving average as an absolute price. The APO indicator also denotes it.
It is an oscillator that oscillates above or below the horizontal line. It is used to determine the direction of the price trend on the chart. An absolute price oscillator is also used to identify divergence between the oscillator and price action.

Divergence is another technical confluence that signals the trend reversal in the market.
How does the Absolute Price Oscillator work?
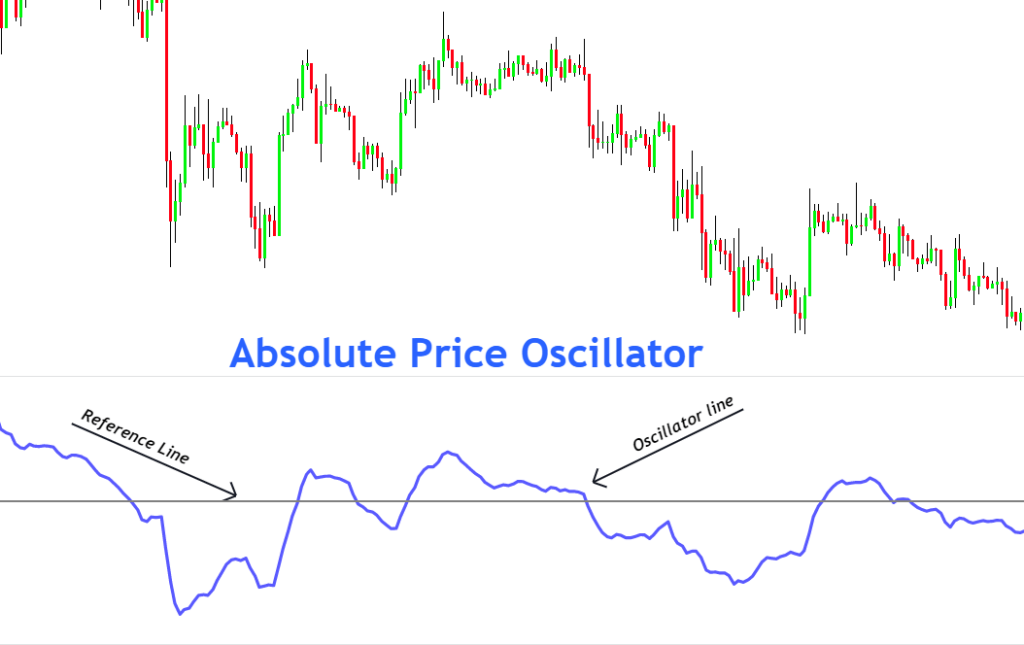
The indicator consists of three main components
- Horizontal reference line (0 value)
- Oscillator line
- Exponential moving averages in the backend
The oscillator line is the resultant value of the difference between fast EMA and Slow EMA. In the case of the bullish trend, the oscillator value will be positive. On the other hand, the oscillator value will be negative during the bearish price trend.
The Horizontal reference line has a fixed value of zero—the oscillator line oscillator around this reference line. The trend’s strength is also calculated by comparing the oscillator value with the zero line.
Two exponential moving averages with the different periods are used as input in this indicator. Usually, traders put 11 and 21 period EMA in this indicator. 11 Period EMA will act as fast EMA, and 21 Period will act as slow EMA.

However, you can choose the exponential moving averages according to your strategy.
The formula of the absolute price oscillator
The calculation of the APO indicator is simple.
APO formula = Value of Fast Period EMA – Value of Slow Period EMA
How to identify divergence in the APO indicator?
There are four types of divergences in technical analysis. These are used to detect trend reversal, but divergences can also find target levels.
For example, you place a buy order when APO crosses the zero line in a positive direction. Then you should hold your trade until you find any bearish divergence on the oscillator. This will make you a patient trader, and sometimes you will get very profitable trades.
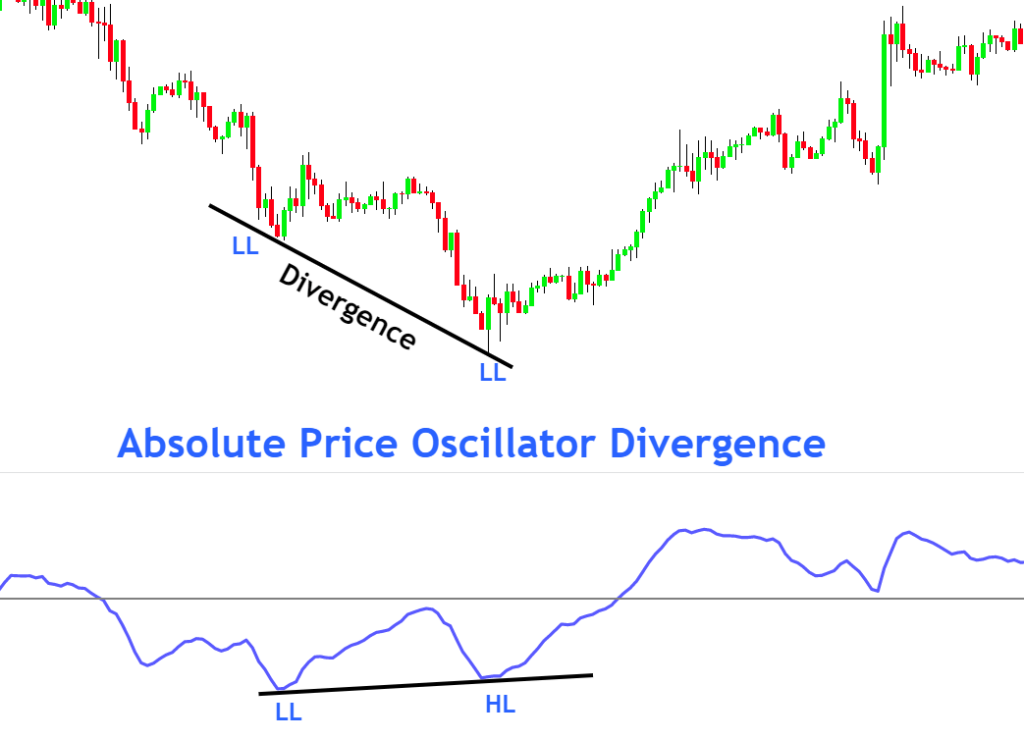
Bullish divergence
When price makes lower lows, and the oscillator line will make high lows, then a bullish divergence forms between the price and oscillator. It represents a bullish trend reversal.
Bearish divergence
When price makes higher lows and oscillator makes lower highs, a bearish divergence forms. It indicates a bearish trend reversal.

How to trade using absolute price oscillator?
Trading with ABO is very simple, but you should always add other technical tools with this indicator to increase the probability of winning.
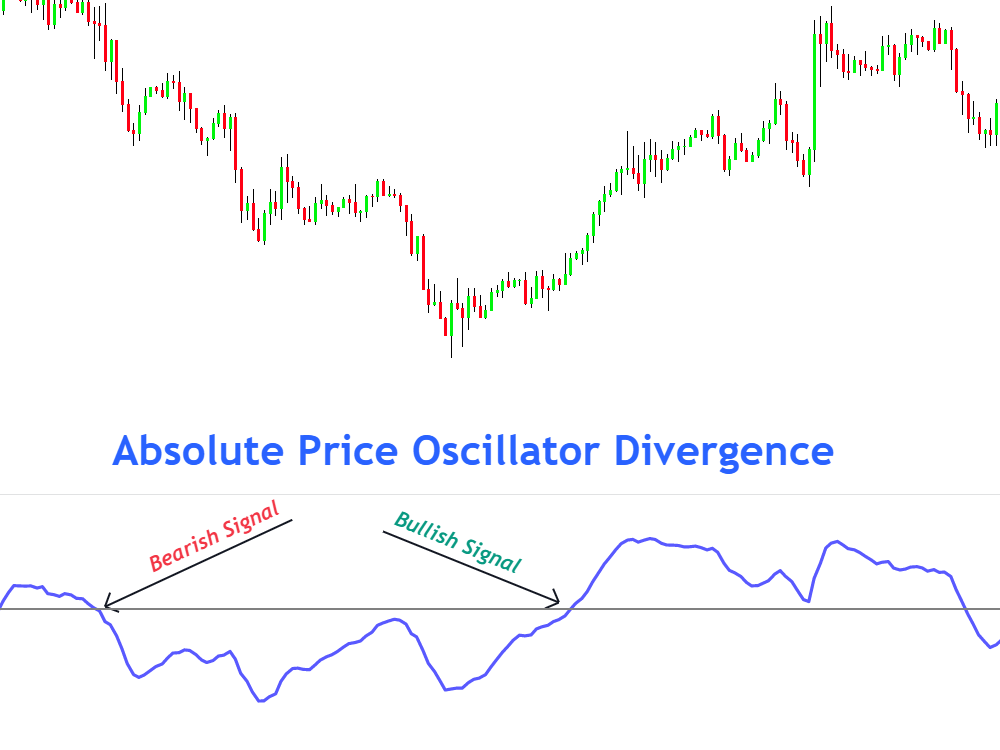
- When the oscillator value crosses the zero line from negative to positive, it shows a bullish trend. A higher positive oscillator value means the strong bullish trend
- When the oscillator value crosses the zero line from positive to negative, it shows a bearish trend. A lower negative value means a strong bearish trend.

The Bottom line
The absolute price oscillator originated from moving averages, and traders use it to confirm the trend direction. It is a beginner-friendly indicator.
It would be best to use the APO indicator as a confluence of trend direction in trading.

