
Definition
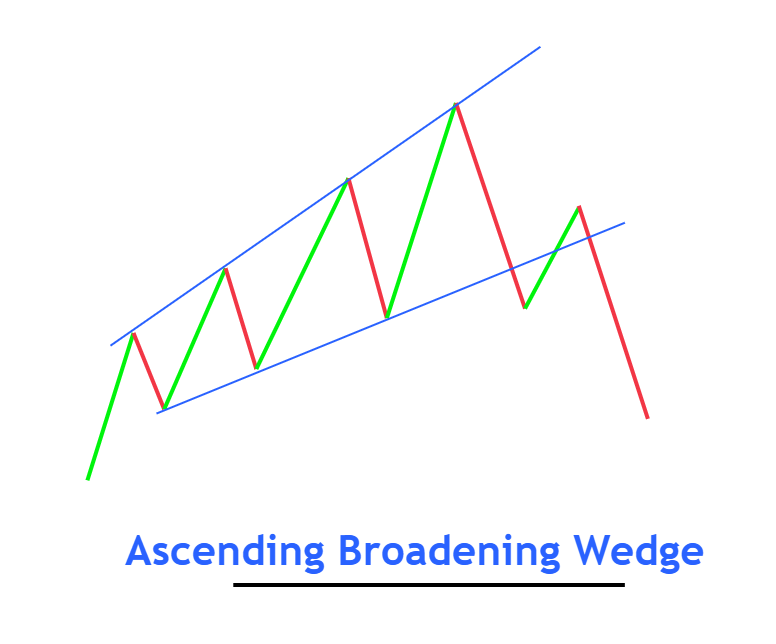
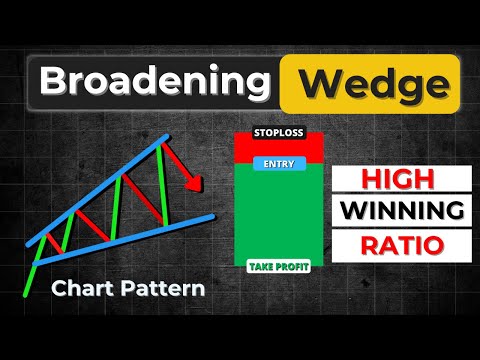
Ascending Broadening Wedge is a bearish trend reversal chart pattern consisting of expanding wave with two trendlines in an upward direction.
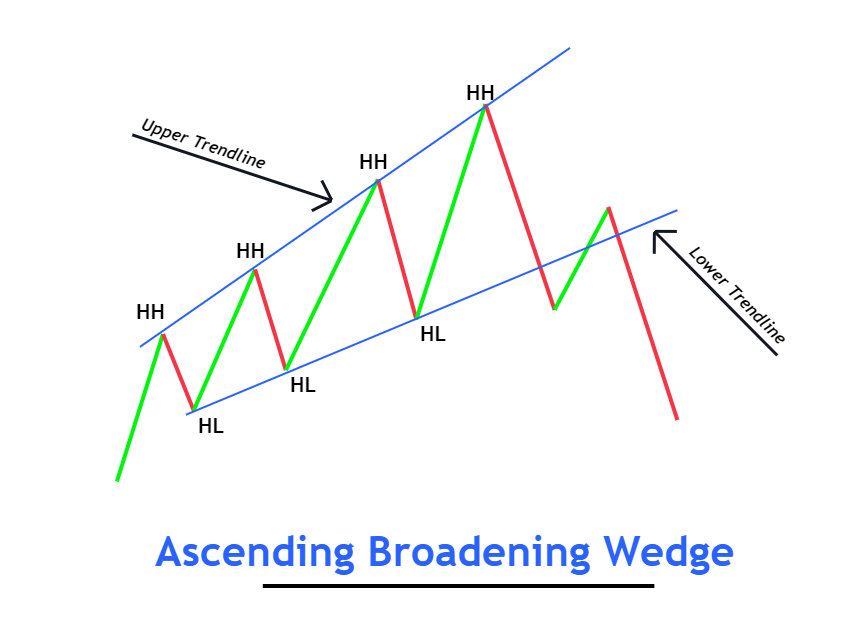
The upper trendline acts as the resistance line and the lower trendline act as the support line. This chart pattern shows a bearish signal with a high winning rate. That’s why traders widely use ascending broadening wedge pattern.
It is the opposite pattern of descending broadening wedge pattern.
How to identify ascending broadening wedge pattern?
Wedge is a structure that has one thin and one thick end. As the name suggests, it expands with time from the narrow end to the wide end.
- To identify this pattern on the chart, follow the following steps:
- Find the wave’s starting point, and the wave should make higher highs and higher lows.
- Each upcoming wave should be greater in size than the previous wave. It will make a broadening wedge-like structure.
- Draw two trendlines meeting the swing high and swing low points.
- There must be at least three waves within ascending broadening wedge pattern.
It would be best to keep in mind that the trend before forming an ascending broadening wedge pattern should be bullish because it should form at the top of the chart for better results.
Pro Tip: The relative strength index indicator will also show the bearish divergence during ascending broadening wedge pattern formation. So, it is a plus point in forecasting the price trend reversal.
What does ascending broadening wedge pattern tell traders?
The structure of this chart pattern shows that price is slowly moving in a bullish direction and breaking the key levels created by sellers. The expansion of the wave indicates that the momentum is increasing in the market with time. And soon the market will take a big decision.
Let me explain you in detail
When price makes higher highs and higher lows, it shows the break of key levels. On each higher high, the price will break a resistance level. And sellers are weak, and they cannot compete with the buyers. But the number of sellers is increasing with time.
On each wave’s formation, the wave size increases, showing that buyers require more effort to push the price in the bullish direction. After 3 to 5 attempts, buyers will fail to keep the bullish momentum, and many sellers will enter the market. This will cause a bearish trend reversal.
While analyzing the market, you should try to read the market structure. In this way, you will filter the good patterns from the crowd.
How to identify trendline breakout?
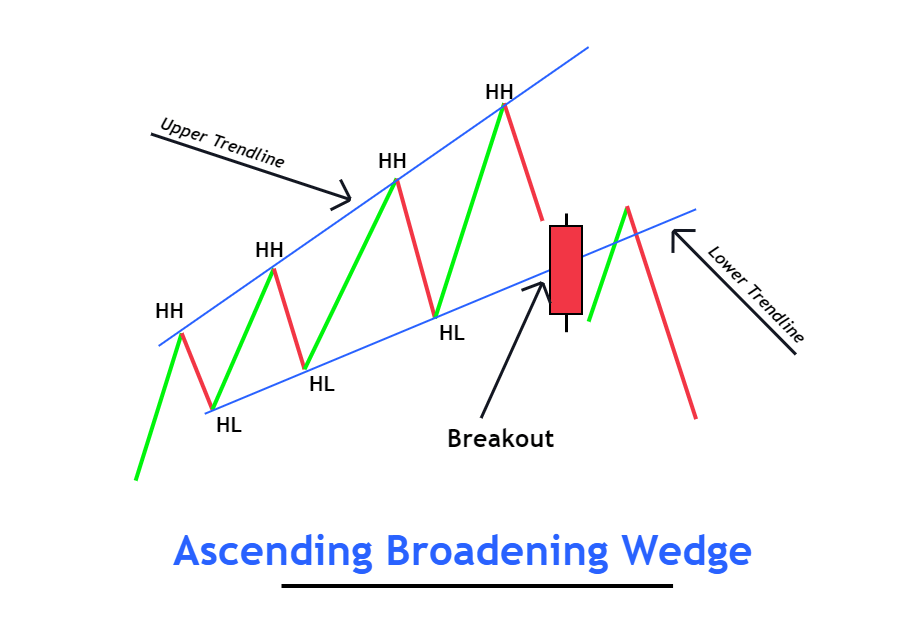
Price will break the lower trendline. Many false breakouts can happen, but you should always show patience.
There is a simple and effective method to filter false breakouts of the trendline.
The breakout of trendline should always happen with a big bearish candlestick. A big candlestick means a candle with more than 70% body to wick ratio. Big body and small shadows. It shows the enormous momentum within less time at the support line.
After the breakout, you can also wait for the price to retrace in a bullish direction because this will confirm that either there is a true trendline breakout or a false trendline breakout.
Conclusion
The origin of ascending broadening wedge pattern acts as the target level for sellers. Due to high accuracy, this chart pattern is widely used by retail traders to forecast the market. Many traders use the RSI indicator with this chart pattern.
The best way to trade chart patterns is by using the confluence of the most basic technical analysis tools like supply & demand zones, Fibonacci tool, and key levels.
Before trading on a live account, make sure to backtest ascending broadening wedge pattern.