
ATR, aka Average True Range, is a volatility indicator that uses moving averages for its calculations.
The ATR bands indicator is an advanced version of the traditional ATR and uses bands to tell volatility.
In this guide, we’ll talk about the ATR bands indicator and how you can trade with it.
Definition
ATR Bands consist of a volatility indicator that illustrates the movement of an asset on average in a timeframe. J. Welles introduced the indicator in the book “New Concepts in Technical Trading Systems.”
The indicator uses the Moving Average to show the volatility of an asset. It plots the moving average below the price chart and travels between a certain range.
ATR doesn’t tell about the trend’s direction; rather, it measures the volatility based on historical price.
ATR bands indicator
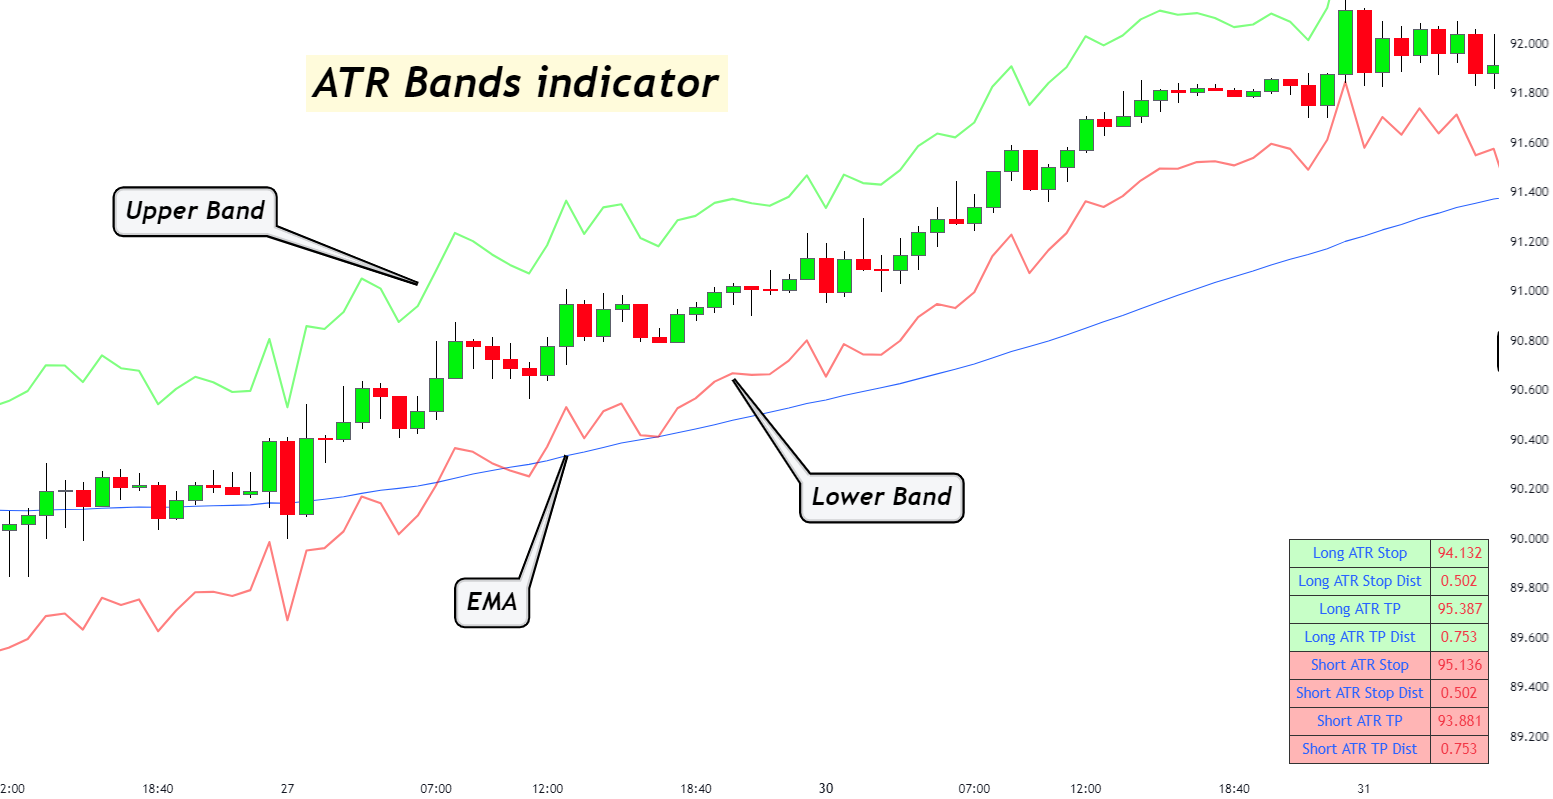
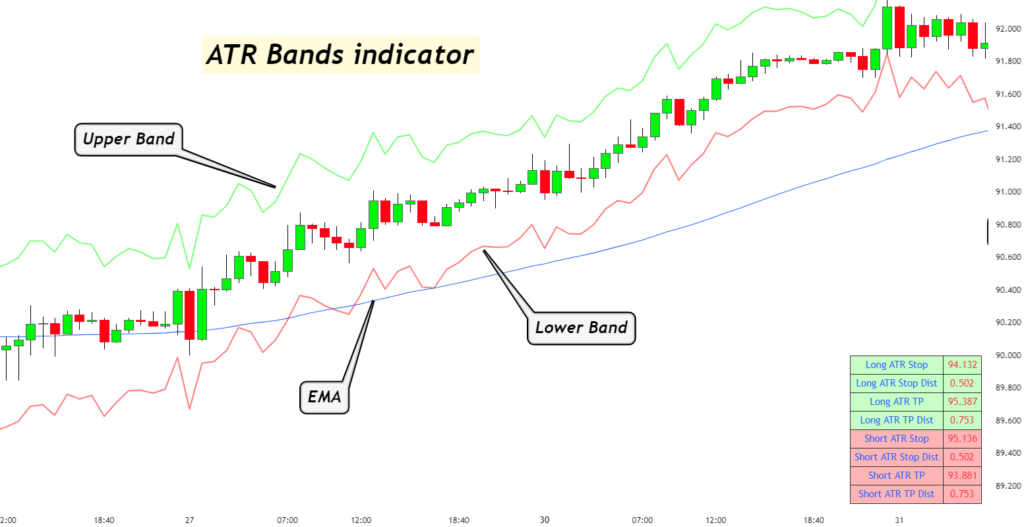
ATR bands indicator is an upgraded version of the traditional ATR indicator. It creates an upper and lower band on the chart.
It looks similar to Bollinger Bands; however, it functions differently. The upper and lower bands mention the price range of the asset. So, the indicator uses the ATR calculations to find the average.
The price moves between these bands and highlights the volatility.
In the chart below, you can see the price moved within the ATR bands. Whenever the price reaches the upper or lower bands, it indicates volatility.
Formula & calculations
The calculations of the ATR Band indicator depend on traditional ATR calculations.
The bands are calculated by adding/subtracting a multiple of the Average True Range to the daily closing price.
For the High/Low option, the multiple of ATR is added to the daily Low, and subtracted from the daily High.
The ATR bands indicator uses J. Wilder’s formula.
If using the default period of 14, the ATR formula is
ATR = ((Previous ATR x 13) + Current TR) / 14
Settings & Configurations
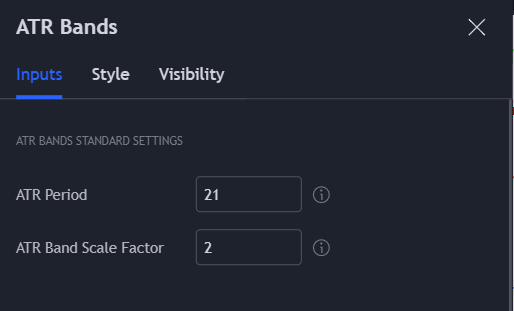
To apply the indicator, you have two settings; ATR Period and ATR Band Scale Factor.
ATR Period is the time period of the indicator. The default setting is 21.
The ATR Band Scale Indicator shows how much the bands should move in an uptrend/downtrend. The default setting is 2. It ensures that the lower band moves up when there is an uptrend, while the upper band only moves when there is a downtrend.
How to use the ATR Bands indicator?
As mentioned earlier, the ATR bands indicator doesn’t provide the trend’s direction. However, it is a strong indicator of price breakouts. The price of an asset travels in a range, especially at the start of the trend. So, you can use this indicator to mark the price breakout.
When there is no movement, the bands will be closer to each other. Conversely, the bands start to expand when the price makes an uptrend or downtrend. If the bands increase, there is a strong chance that the price breakout is also increasing.
You can also use it as levels of support and resistance. The upper band act as a resistance level, while the lower band act as a support level. So, even if ATR bands aren’t your primary indicator, you can use it to mark support/resistance levels.
ATR Bands trading strategy with EMA
As mentioned above, the traditional ATR doesn’t provide trend direction, so the addition of EMA (exponential moving average) makes the ATR bands indicator good for entering and exiting the trade.
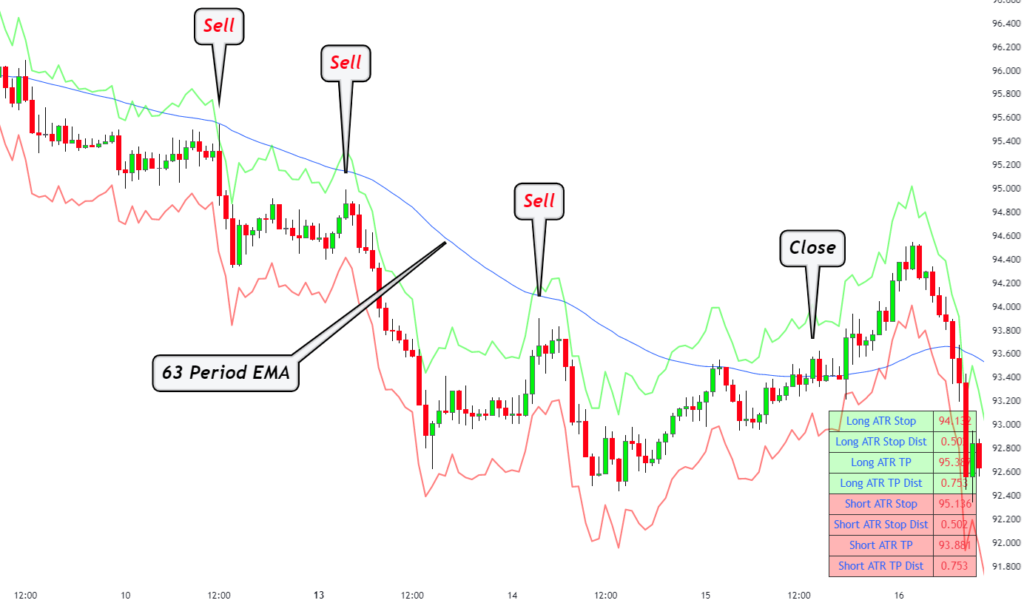
The EMA compliments the upper and lower bands and acts as a trading signal. So, for this strategy, we are using with the 63-period EMA.
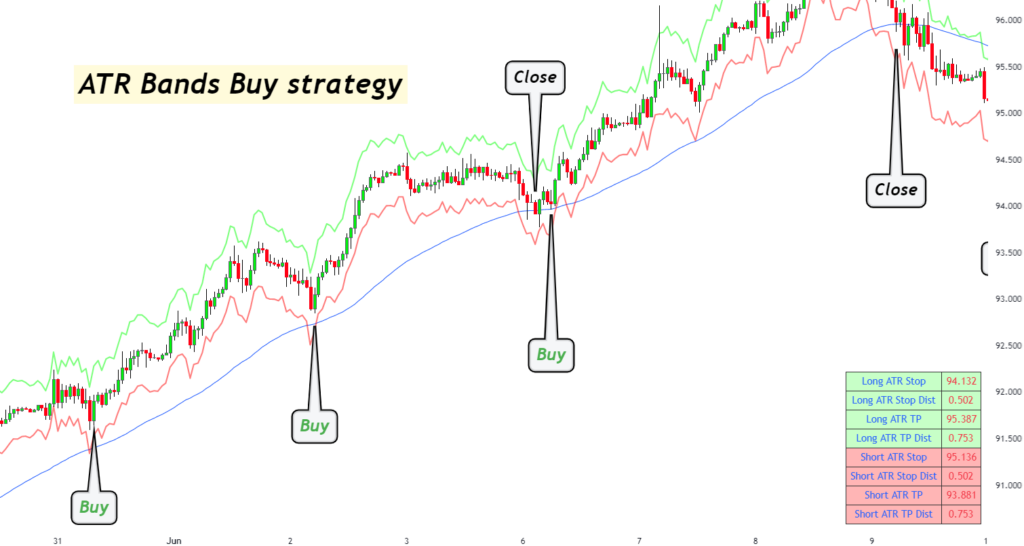
Buy signals
- The price should be near the lower band.
- The price must be above the EMA.
- Wait for the price to continue moving upwards and then enter the trade.
- Close the trade when the price starts to come back to the lower band.
Sell signal
- The price should be near the upper band.
- The price must be below the EMA.
- Wait for the price to continue moving downwards and then enter the trade.
- Close the trade when the price starts to come back to the upper band.
The bottom line
The ATR bands indicator is a volatility indicator and can help determine price breakouts. You can use it with the EMA strategy mentioned above for going long or short.