
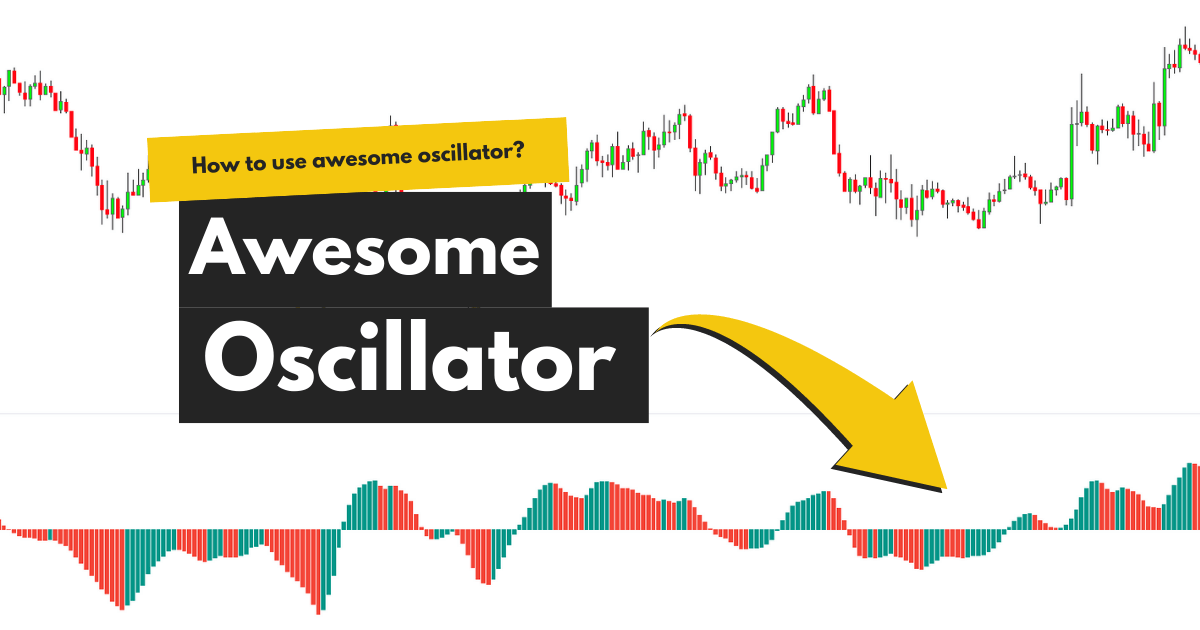
An awesome Oscillator is a momentum oscillator that determines the trend reversal or continuation in forex & stocks.
Developed by Bill Williams, Awesome Oscillator plots a histogram on the chart and calculates the market momentum using a shorter and longer timeframe. These longer and shorter timeframes comprise the SMA (simple moving average).
You can detect the market trends with the AO by navigating the zero-line crossovers.
Formula
The formula for the Awesome Oscillator is
Awesome Oscillator = SMA (median price, (5)) – SMA (median price (34))
Where;
Median price = (high + low)/2
SMA = Simple Moving Average
Calculations
To calculate the Awesome Oscillator, you need to follow certain steps.
First, you need to look at the 34 previous bars and compare them with the five previous bars. As Williams uses the 34 and 5 periods as default, you need to use those values.
After that, you need to find the median price. It is the high and low of the current session divided by 2.
After generating these values, you need to subtract the 34 SMA from the 5 SMA.
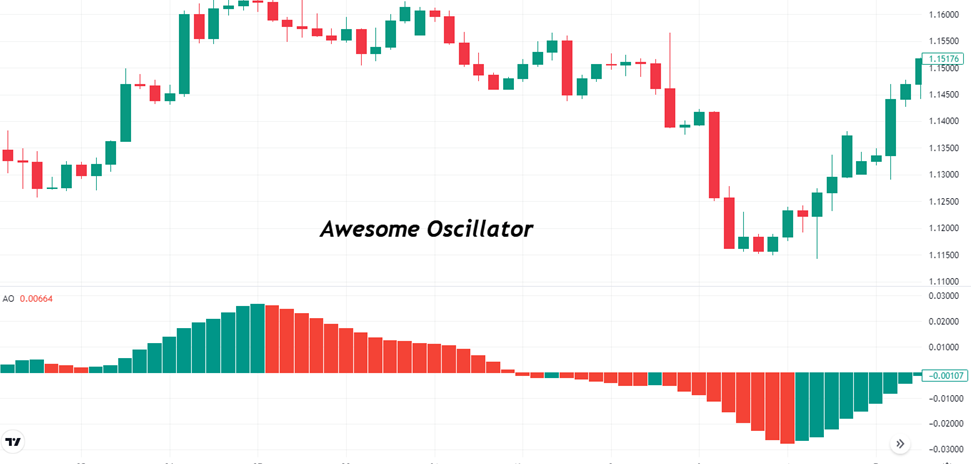
The calculation results in a histogram, which is red and green in color. The histogram plots green bars when the median price is higher than the current bar’s price. Conversely, the histogram paints red bars when the median price is lower than the current bar’s price.
Best settings for the Awesome oscillator
The best settings for the indicator are
The indicator doesn’t; have default settings; rather, it uses SMA to plot the histogram.
As with the other oscillators, you need to select a higher timeframe when applying the AO to reduce the market noise.
How to trade with the Awesome Oscillator?
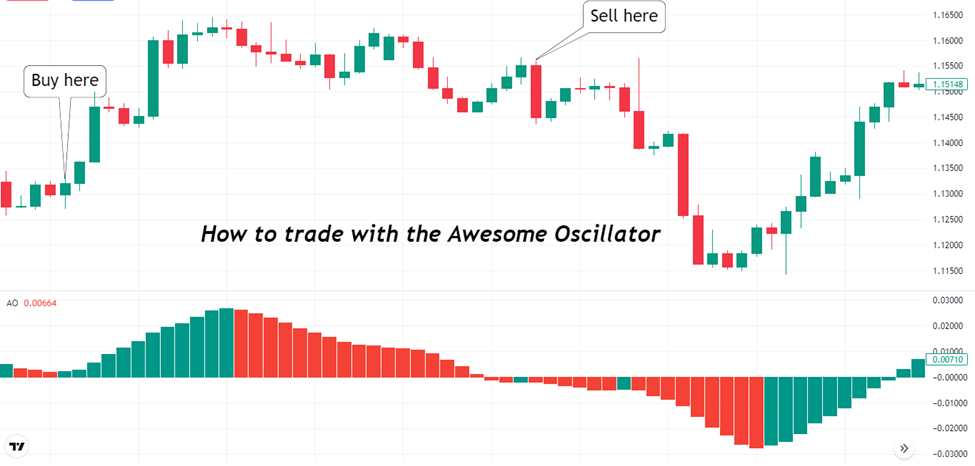
There are three main ways to trade with the indicator; zero-line crossovers, saucers, and twin peaks.
When the AO crosses above the zero line, you can enter long positions or exit short ones. Conversely, when the AO dips below the zero line, it suggests a bearish momentum, and you can enter short or exit long positions.
The next way to trade with the oscillator is to locate the saucer. When the histogram plots three consecutive bars (two red followed by a green bar), and the second bar is lower than the first one, you can take buy positions on the fourth bar.
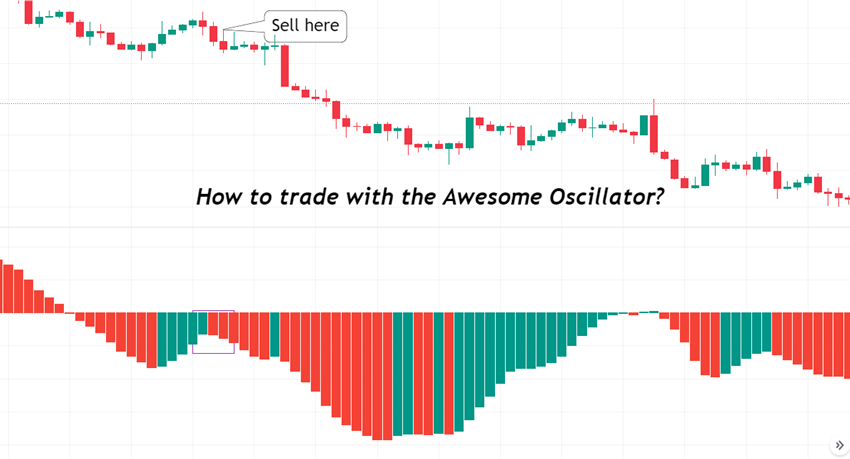
On the other hand, when the histogram draws three consecutive bars (two green followed by a red bar) and the second bar is lower than the first one, it’s a sign of a downtrend.
On the chart below, you can see when the AO plotted two green bars followed by a red bar, and the second bar was lower than the first one, we saw the price moving downwards.
The third method to trade with Awesome Oscillator is to locate twin peaks. When there are two peaks below the zero line, the second peak is higher than the first one, and the trough between the peaks remains below the line, it suggests bullish momentum.
On the other hand, when the two peaks form above the zero-line, where the second one is lower, and the trough above the zero-line, it signifies a bearish momentum.
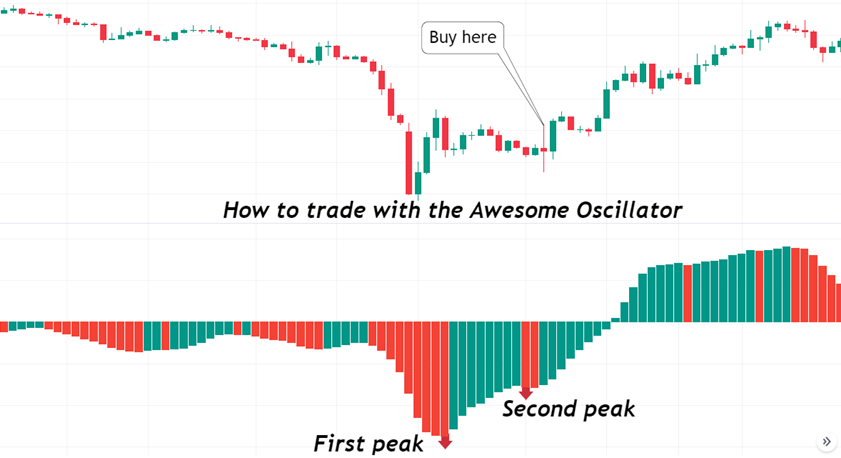
In the chart above, you can see the histogram forming two peaks. The bars did remain below the zero line, and after the formation of the second peak, the price moved upwards.
Advantages
- The indicator is relatively easy to understand.
- You can use the oscillator in multiple ways.
Awesome Oscillator vs. MACD
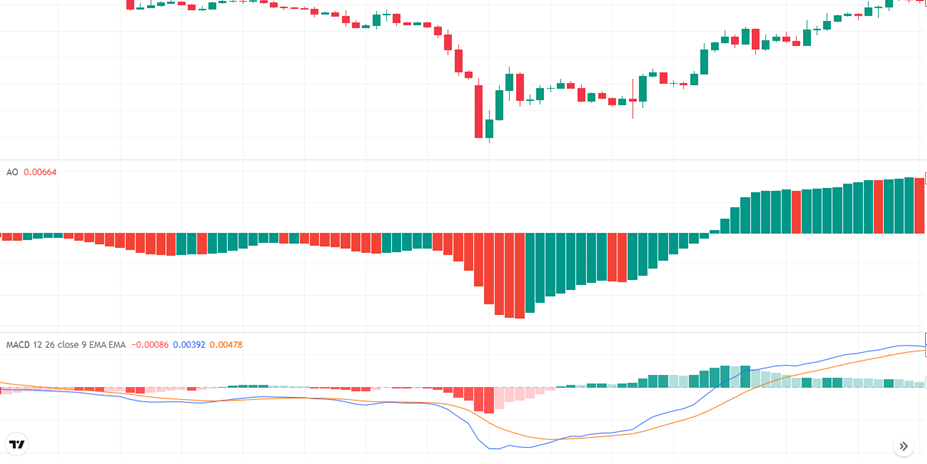
MACD (moving average convergence divergence) may look like the Awesome Oscillator, but both are different.
Firstly, they use different calculations. AO uses the SMA for its calculation, whereas MACD uses two EMAs.
Secondly, there is a signal line on the MACD, while the AO doesn’t have a signal line.
Summary
The Awesome Oscillator uses the SMA to plot the histogram on the chart. Using the zero line as a benchmark, you can locate the trend continuation or the reversal.
The good thing about the AO is you can use it for multiple strategies.
Although the indicator works fine on its own, you can use Awesome along with others for further signal confirmation.