Definition
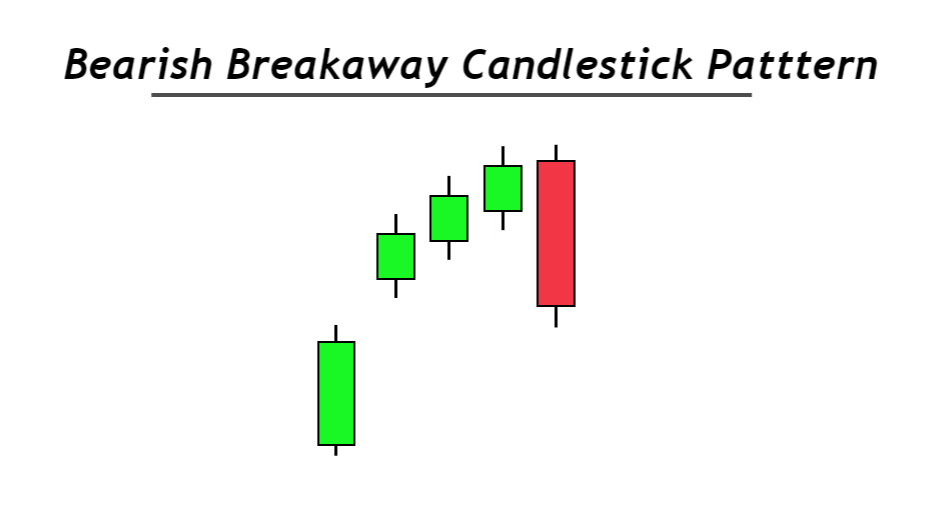
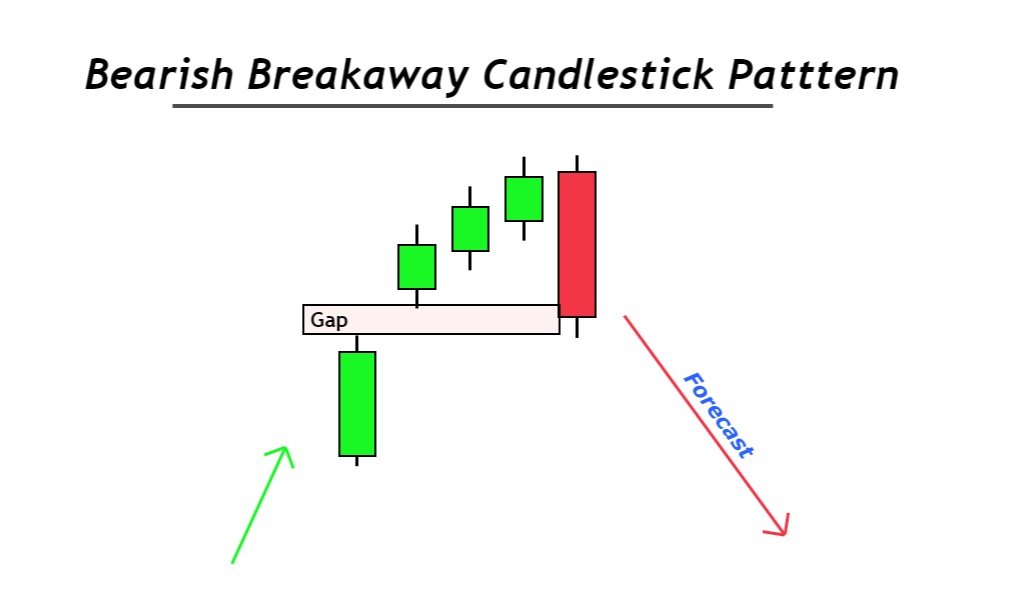
Bearish breakaway is a bearish reversal candlestick pattern that consists of five candlesticks and a gap zone. After forming this candlestick pattern, a bullish trend will turn into a bearish price trend.
It is the opposite of the bullish breakaway pattern. A small gap also formed within the first two candlesticks showing the bullish momentum. Bearish breakaway pattern forms rarely on the price chart because of the strict rules of five candlesticks in a series.

How to identify a bearish breakaway pattern?
To confirm a bearish breakaway pattern, the five candlesticks and gaps should form in a specific sequence.
Here is the sequence of candles to find a breakaway pattern
- The first candlestick should be a significantly bullish candlestick with a higher body-to-wick ratio.
- The second candlestick should open with a gap up and close higher than the opening price.
- The third candlestick will be bullish, and it should close above the closing price of the previous candlestick.
- The fourth candlestick will also close above the previous closing.
- The fifth candlestick will be a big bearish candlestick. It will open within the range of the previous candlestick and close within the gap range (above the closing price of the first candlestick).

You should strictly follow all the above rules in this sequence. That’s why it rarely forms on the chart.
Bearish breakaway: Information Table
| Features | Explanation |
|---|---|
| Number of Candlesticks | 5 |
| Prediction | Bearish trend reversal |
| Prior Trend | Bullish trend |
| Relevant Pattern | Evening Doji Star |
What does bearish breakaway candlestick tell traders?
Two major patterns form within this candlestick pattern.
In the first pattern, buyers try to increase the price with a big bullish candlestick and a breakaway gap of a specific resistance level. After then the momentum of buyers decreases because small bullish candlesticks will form.
In the second pattern, sellers overcome the buyers, and a big bearish candlestick will form. They show that sellers have engulfed the last three sessions of buyers, and now they will control the price in the future.
According to the bearish breakaway pattern, the bearish candlesticks close within the gap range. But it should close below the closing price of the first candlestick. That’s why it is advised to wait for the formation of a bearish confirmation candlestick after this pattern.

Find High Probability Trades with this ADVANCED Candlestick Patterns Course
The Ultimate Candlestick Patterns Course That Will Help You To Trade Better
How to trade a bearish breakaway pattern?
A trading strategy consists of rules of risk-reward, risk management and technical analysis. But here will explain a few confluences that can increase the winning ratio of this candlestick pattern.
Here are the confluences
- The bearish breakaway pattern should form at the top of the resistance or supply zone price chart.
- It should form during overbought price conditions
- It should not form within a ranging price structure.
The supply zone or resistance level benefit is that the probability of bearish price trend reversal will increase. On the other hand, you can also place a safe stop loss above the resistance or supply zone. Because these zones will protect stop loss from price spikes.
The Bottom Line
The bearish breakaway pattern is used for trading in stocks and indices. In forex, it is advised to not use it for intraday or swing trading because of rareness. You can use other candlestick patterns like pin bar, engulfing etc.

