
Introduction
Bearish candlestick patterns refer to those patterns that cause a trend change from bullish to bearish or continuation of the bearish trend.
Many candlestick patterns predict the bearish price trend, but you will learn to trade with the top 4 universal candlestick patterns in this article. These patterns apply to the candlestick chart of any market in the world like stocks, forex, cryptocurrency, etc.
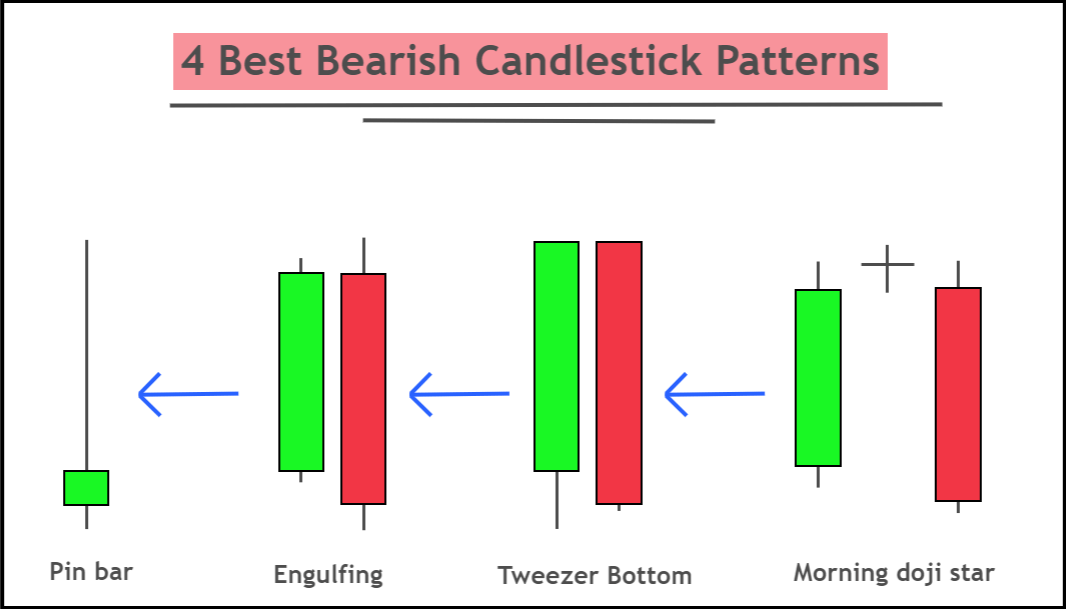
What are the top 4 bearish candlestick patterns?
Pin bar, engulfing, evening Doji star, and tweezer top are the best four candlestick patterns used in every market for forecasting.
Here’s a short explanation of each candlestick pattern, but you can learn in detail by reading complete articles.
Bearish Pin bar
The pin bar is a single candlestick pattern with a long tail and a small head. A long tail will form on the upper side in a bearish pin bar, and a small head will form on the lower side.
The bearish pin bar should have less than 30% of the body-to-wick ratio. It will form at the end of a bullish trend because it is a bearish reversal candlestick pattern.
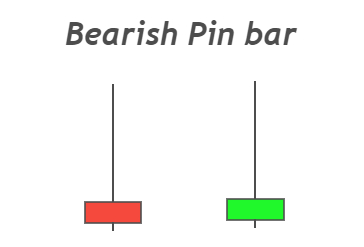
The long tail on the upper side shows that sellers control because buyers tried to push the market in the bullish direction. But sellers were strong enough to decrease the price. It’s also an indication of rejection from a resistance zone.
The color of the pin bar candle does not matter. The main thing is the structure and location of this pattern.
Bearish engulfing candlestick
The engulfing candlestick pattern consists of two opposite color candlesticks. In bearish engulfing, the first candlestick will be a bullish candle, and the second candlestick will be a bearish candle. The bearish candlestick will fully engulf the bullish candle showing that sellers have overcome the forces of buyers, and now they will control the market.
Bearish candlestick will make a higher high and lower low. Body to wick ratio of both bullish and bearish engulfing should be greater than 60% because the big body candlestick shows the momentum.
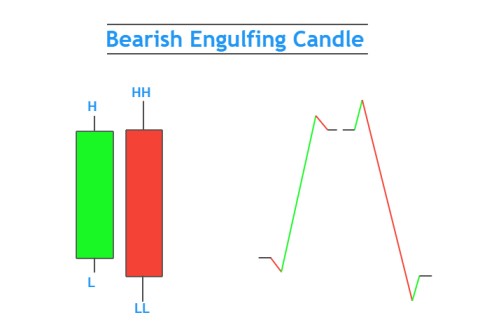
This pattern will form at the end of a bullish trend because it is a bearish reversal pattern. It has a high probability of winning and is most widely used by retail traders to forecast the market.
Evening Doji star
The evening doji star is a bearish reversal candlestick pattern. It consists of a bearish candle, a Doji candle, and a bullish candle.
The body-to-wick ratio of bearish and bullish candlesticks should be greater than 60%. And the Doji candlestick will form with a gap up. The bearish candlestick must always close below the 50% level of the first bullish candlestick because it shows that the sellers have cleared the major hurdle created by the buyers. And now they are in control and price will decrease.
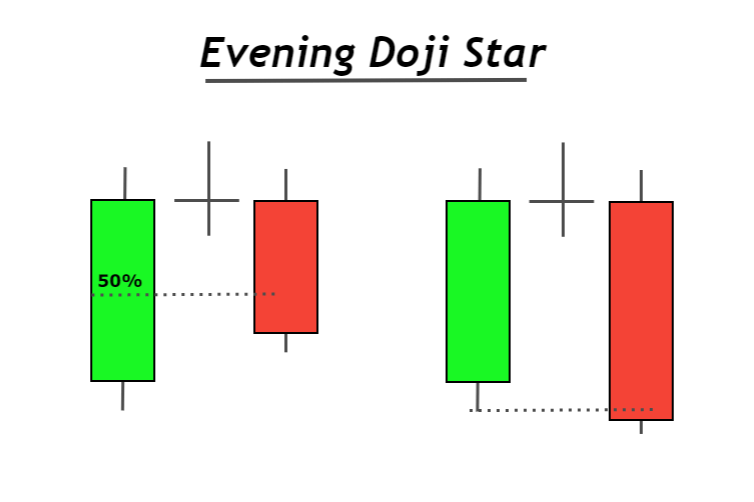
The probability of bearish trend reversal will increase when the evening Doji star forms at the resistance zone.

Find High Probability Trades with this ADVANCED Candlestick Patterns Course
The Ultimate Candlestick Patterns Course That Will Help You To Trade Better
Tweezer top
The tweezer top candlestick pattern consists of two opposite color candles with no shadows on the upper side. The closing price of the first bullish candlestick will equal the opening price of the first bearish candlestick.
Bearish candlestick should always close below the 50% level of bullish candlestick because it shows that sellers control the market. As the buyers failed to make a new higher high, sellers broke 50% of the previous candlestick. These are signs of a bearish trend reversal.
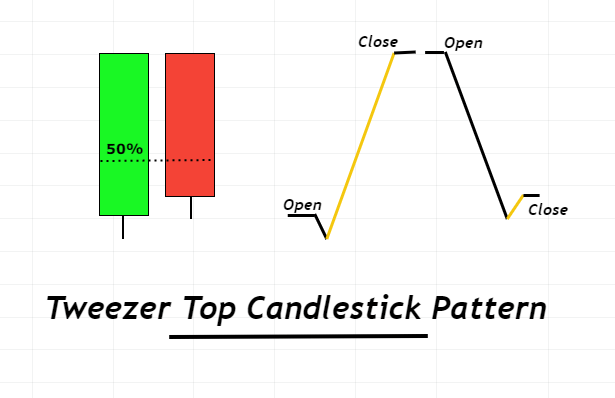
It will form at the end of the bullish trend and some resistance or supply zone.
Pro Tip: The bearish reversal candlestick pattern should always form at the top of the chart. because the probability of bearish trend reversal will increase when the price will be in overbought conditions.
Conclusion
The trading psychology is the same for all 4 candlestick patterns because they will make a pin bar candle on a specific higher timeframe. For example, a bearish engulfing candle on 15M timeframe will make a pin bar on 30M timeframe
That’s why there’s only a timeframe difference between these candlestick patterns.
Before trading on a live account, it is recommended to backtest the candlestick patterns properly.