
Introduction
This post will teach you about all types of bearish continuation candlestick patterns. These candlestick patterns indicate that downtrend will continue in the market to keep the sell trade open to generate more profit from the market.
Candlestick patterns are building blocks of technical analysis in trading, and a trader should always focus on learning these candlestick patterns properly. Advanced traders also use candlestick patterns to forecast the market.
Definition
A candlestick pattern that predicts a further downward trend in the already falling market is called a bearish continuation candlestick pattern. It means the price will fall further when a bearish pattern forms in an already bearish trend.
This pattern alerts the buyers to stay away from the market because the market shows the continuation of a bearish trend. It also shows that sellers are dominant in the market and will remain dominant in the upcoming market.
How to identify a bearish trend continuation candlestick pattern?
There is a complete difference between the trend continuation and trend reversal candlestick patterns. The main point that differentiates both patterns is the location because reversal patterns form at the end of the trend while continuation patterns form within the trend.
The simple way to find a bearish trend is by using price action or moving averages. I suggest using the price action because it is the most effective way to determine the bearish trend.
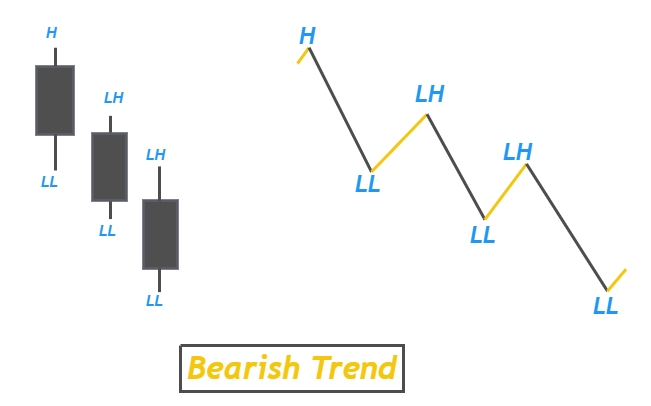
Lower low and lower high formation
This is the most effective method to identify the bearish trend in the market. When the price makes lower lows and lower highs, it shows a bearish trend. This is the price action strategy, and I will recommend this method to advance and intermediate traders.
Like in the image below
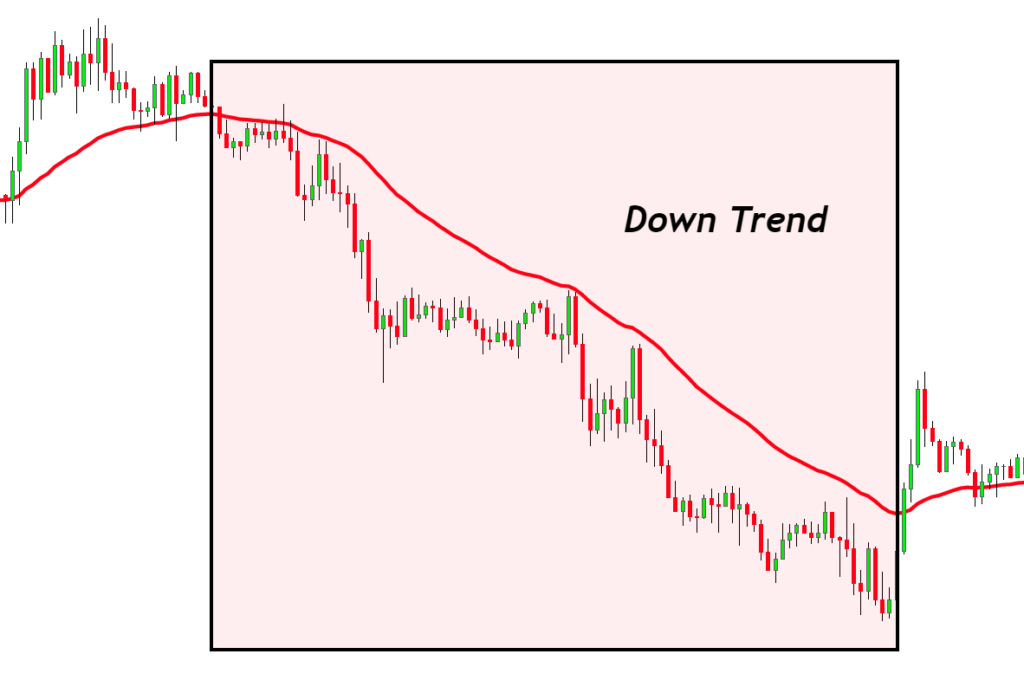
Using moving averages
We can also determine the bearish trend by using the 38-period exponential moving average. The price trend is bearish if the price is below the 38 EMA. The trend is bullish if the price is above the 38-period EMA.
So, our task is to find bearish continuation candlestick patterns during the bearish trend. It is mandatory to check the trend.

Find High Probability Trades with this ADVANCED Candlestick Patterns Course
The Ultimate Candlestick Patterns Course That Will Help You To Trade Better
List of bearish continuation candlestick patterns
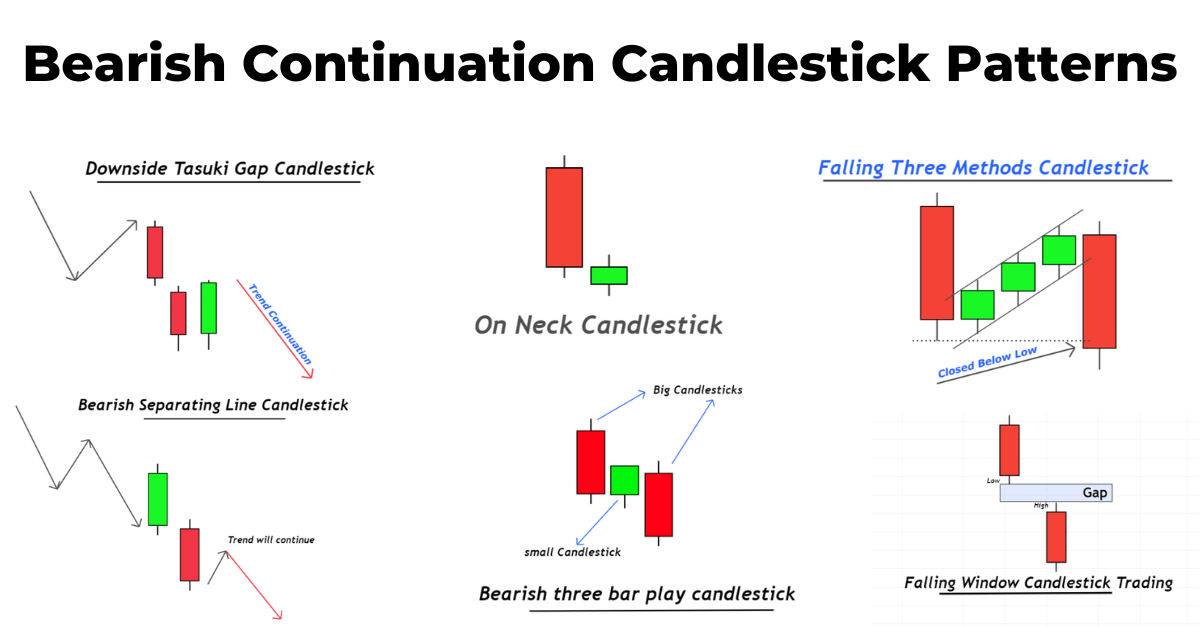
Here is the list of six bearish continuation candlestick patterns with a short explanation.
Falling three methods
Falling three methods is a bearish trend continuation pattern that consists of five candlesticks. Two big bearish and three small base candlesticks combine in a specific sequence to make a falling three methods pattern.
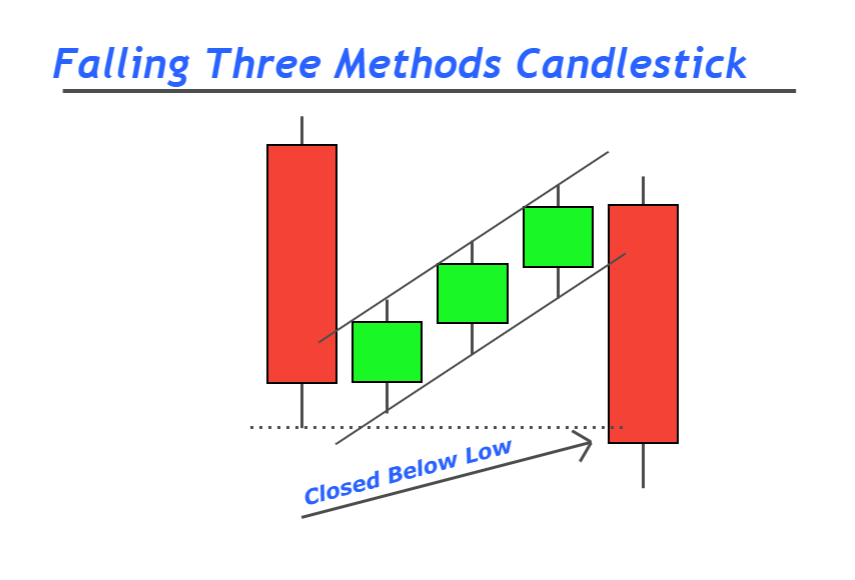
This candlestick pattern forms in a specific sequence. First, a big bearish candlestick will form, showing the dominance of sellers. Then three small bullish candlesticks will form within the range of the previous candlestick. These three small bullish candlesticks indicate retracement upward. Then again, a big bearish candlestick will form, engulfing the previous three candlesticks. Falling three methods candlestick pattern shows that sellers will remain dominant over the buyers.
This small candlestick has many hidden price action patterns, and you will learn those patterns by reading the chart on lower timeframes.
You should follow some rules you can learn by clicking the learn more button. I have also explained a complete trading strategy there.
Falling window candlestick
The falling window is a bearish trend continuation pattern that consists of two bearish candlesticks with a gap between both candlesticks. The gap shows the imbalance area, which forms due to filling large pending sell orders.
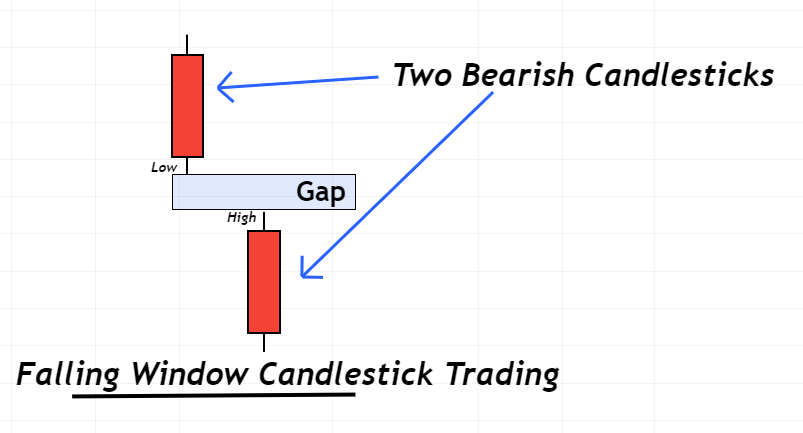
It is a natural phenomenon that price always tends to balance the imbalance area. That’s why the price will retrace to the imbalance or gap area. Then after filling the gap, the price will continue its previous bearish trend.
The two big bearish candlesticks and a gap show the huge number of sellers in the market. Then the retracement of price towards the gap zone shows the weakness of buyers. This is an indication of a bearish trend continuation in the market.
On neck candlestick pattern
On the neck is a bearish candlestick pattern that consists of two candlestick patterns. In this pattern, the first candlestick will be a big bearish, and the second candlestick will be a small bullish candlestick. The second candlestick will open with a gap down and close below the price of the bearish candlestick.
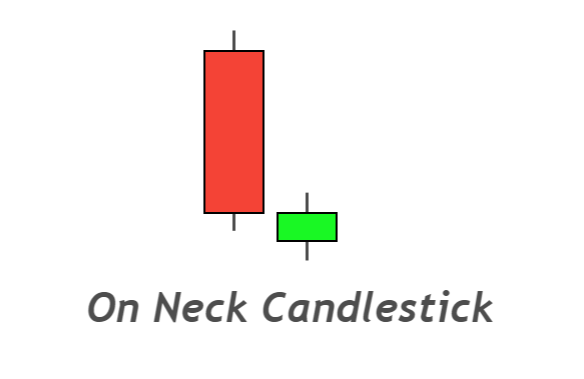
Here the bearish candlestick and a gap are the significant of sellers in the market. At the same time, the small bullish candlestick that closes below the closing price of the previous candlestick shows the weakness of buyers in the market.
When on neck candlestick pattern forms in bearish trend, you should open a sell trade or keep holding sell orders.
Bearish separating lines
Bearish separating lines is a continuation candlestick pattern that consists of two candlesticks of opposite color and a down gap between them. The size of both candlesticks will almost be the same, but it is not compulsory. First, a bullish candlestick will form, then a bearish candlestick will form with a large gap down. The bearish candlestick will close below the low of the bullish candlestick.
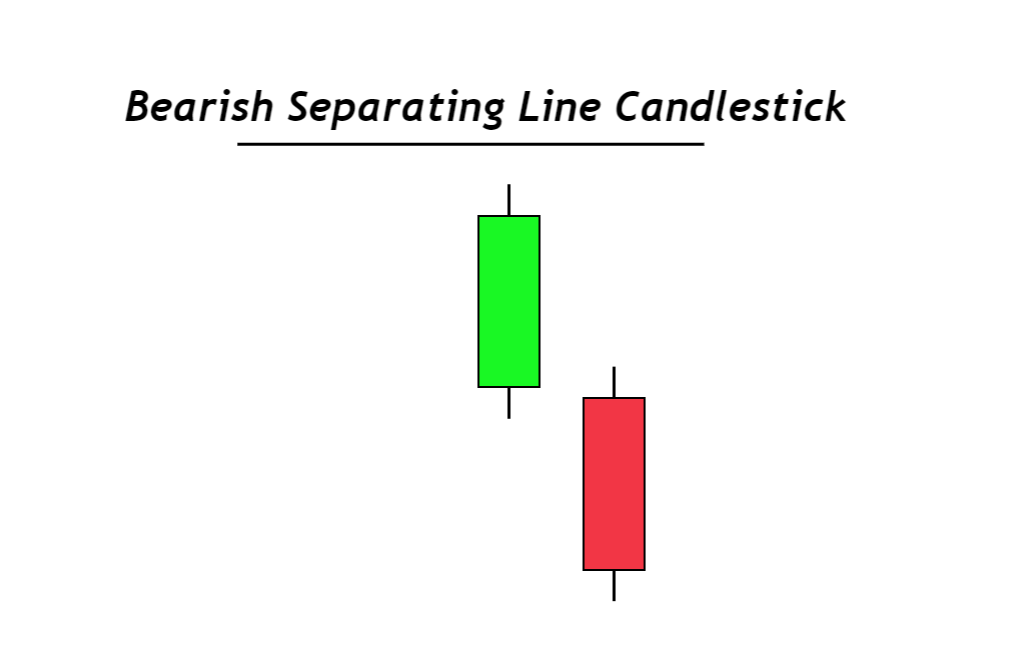
This pattern will form during a bearish trend, indicating that price will continue falling. You should open a sell trade after a minor bullish retracement.
Downside Tasuki Gap
The downside Tasuki gap is a candlestick pattern that consists of three candlesticks and a downside gap. It is a bearish trend continuation pattern in which the first candlestick will be bearish. Then the second candle opens with a gap down and close with a bearish body. Then the third candlestick moves up to the gap zone but does not cross the gap region.
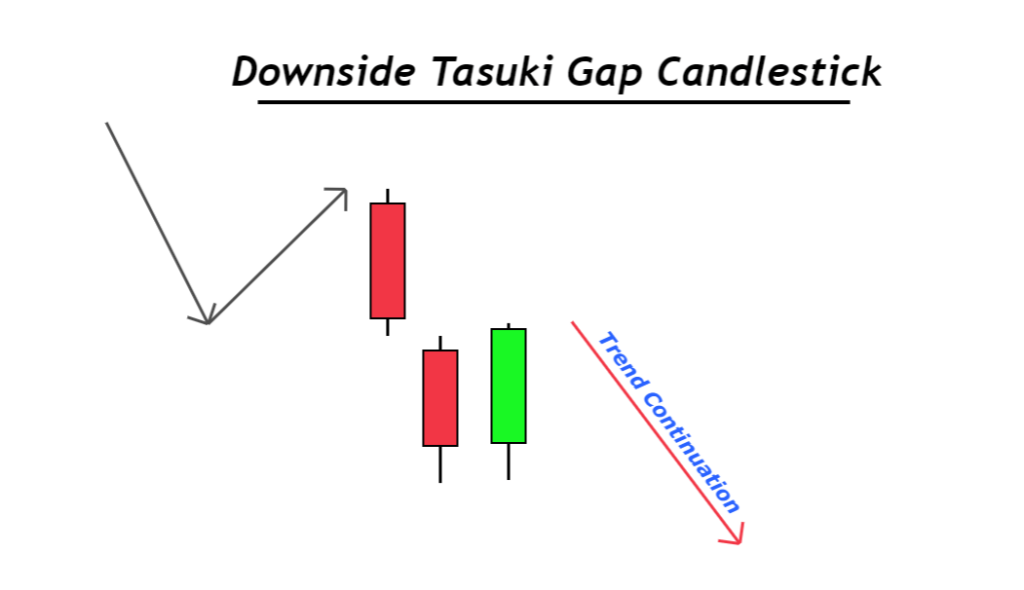
Two bearish candlesticks with a down gap show the strength of sellers, and closing bullish candle before the gap zone indicates the weakness of buyers. So, sellers are dominant here represents price will continue downtrend.
It must form during a downtrend.
Bearish three-bar play
Bearish three-bar play is a trend continuation candlestick pattern that also consists of two big red candlesticks with a base candle. This also draws the supply zone like drop base drop pattern in supply and demand trading.
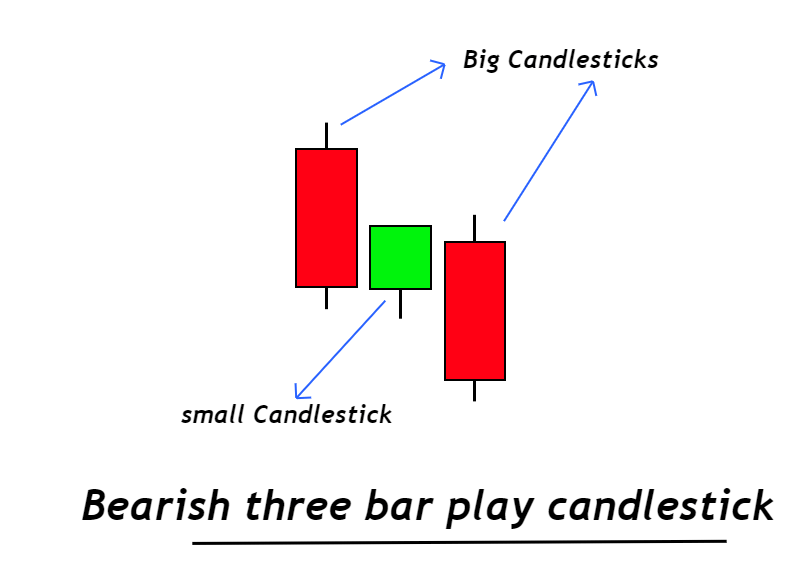
In this pattern, you should open a sell trade just after three-bar play formation and then place a stop loss above the high of the base or middle candlestick.
The bottom line
Candlestick patterns play an essential role in forecasting the trend of any market. Here I have explained the six bearish trend continuation candlestick patterns that are very important for forex and stock traders.
The winning ratio of continuation candlestick patterns is greater than that of reversal. Make sure to backtest each pattern properly before using it on a live trading account.