
Definition
The bearish flag is a continuation chart pattern that resembles the shape of a flag and it consists of two basic price waves in technical analysis.
The bearish flag pattern is the most widely used chart pattern in forex and stocks trading. As the name suggests it forecast a downtrend in price. Due to the characteristic of trend continuation, this chart pattern has a high probability of winning if traded with a perfect strategy.
How to identify a bearish flag pattern?
It consists of two basic elements that make the structure of a flag
- Pole
- Flag
These two elements combine to make a flag chart pattern.
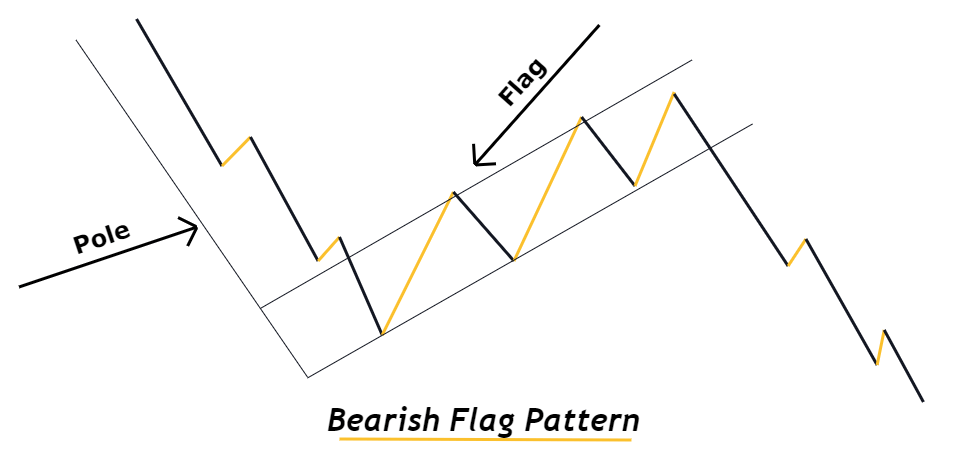
What is pole and flag in trading?
Flag and pole represent a particular type of structure of the price on the chart. In technical analysis, a trader always looks for patterns that repeat. Then he tries to predict the price using these patterns.
In the same way, a flag in a bearish flag pattern represents the retracement phase of the market and a pole represents the impulsive phase of the market.
This is a natural behavior of the market that after the impulsive phase, the retracement phase starts and vice versa. So according to this, after flag pattern breakout, a retail trader will trade an impulsive phase with a big profit.
Criteria for a valid chart pattern
- To identify a good bearish flag pattern, follow the following rules.
- The pole must indicate a bearish impulsive wave
- The flag must represents an upward retracement phase. A flag mostly consists of two to three smaller price waves. These smaller waves form a channel like price structure. You need to understand the pattern of flag to detect a flag pattern correctly on the chart.
- The retracement phase must not cross the 61.8% Fibonacci level. It should remain below this Fibonacci ratio. If retracement crosses the 61.8% Fibonacci level then itnis an indication of weak bearish trend.
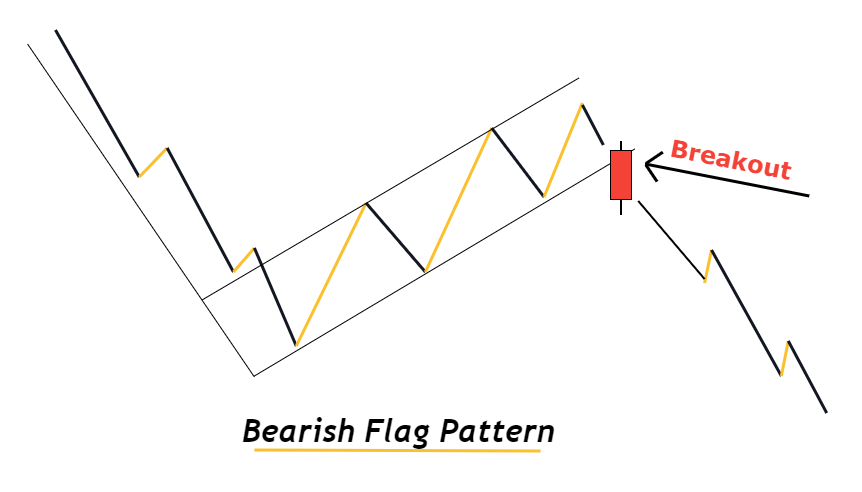
- Breakout of flag pattern must be with a big bearish candlestick breaching through the channel boundary.
What does a bear flag pattern tell traders?
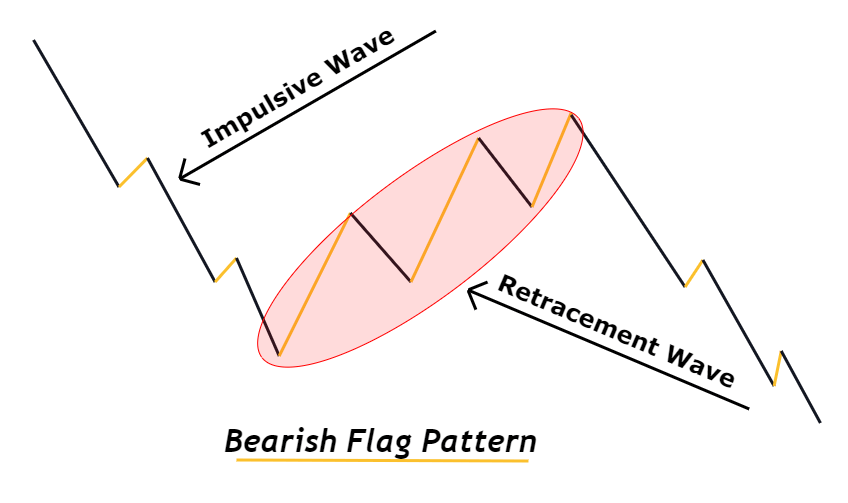
There are two basic price waves in technical analysis
- Impulsive wave
- Retracement wave
Bearish Impulsive price wave represents the high potential of big traders who are selling with high speed. A minor retracement wave after a bearish impulsive wave indicates the process of balancing the market with a minor pullback. During the balancing process, market makers prepare for the next upcoming bearish impulsive.
You should try to read the price because this will make you able to identify a correct and a false chart pattern. By reading the price technically, you can see what is happening behind the chart. With the screentime and practice, you will be able to look at the chart like a professional trader.
The main theme of this heading is that you should focus on detecting the impulsive and retracement phase correctly.
Bearish flag pattern trading plan
The trading plan for the flag patterns is very simple. This plan will guide you about stop-loss, take-profit, Entry, and risk management. In the strategy section, you will learn to filter out good setups from the crowd by addition of confluences.
Open a Sell trade after bearish flag pattern
The flag of this chart pattern is made up of two trendlines like a channel with upper and lower trendlines. A sell signal is generated when a big bearish candlestick breaches through the lower trend line and breaks the channel.
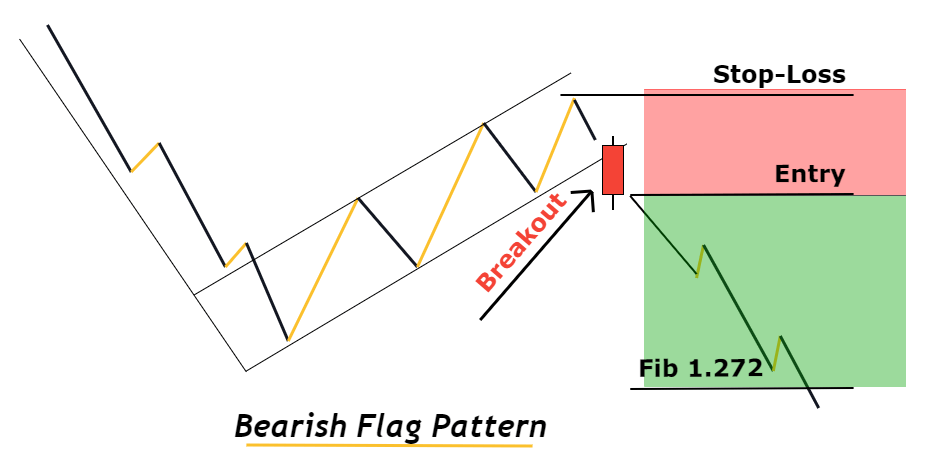
Place a sell order just after channel breakout.
Pro tip: To avoid false flag breakout, always look for a breakout with a big Bearish candlestick that closes below the trendline.
Stop-loss level
Place stop-loss above the recently made higher high by the price.
Take-profit level
In the Bearish flag pattern, there are two take-profit levels. Close the half trade at the origin of the impulsive phase and close the rest of the trade at the 1.272 Fibonacci extension level.
Risk management
As you will find fewer flag pattern setups per month, so you can invest 2-5% per trade of your total account balance (for small accounts <$10k). The risk-reward ratio should always be greater than 1:1.5. you should avoid setups with low RR ratios.
Trading confluences
This is the most important part of this topic. without adding confluences, you will not make a profit in trading. Because every retail trader can make a profit by just following few rules that are not possible. Each retail trader should make a unique strategy with unique rules to become a profitable trader in forex trading.
Confluences to add
- Higher timeframe analysis
- Bearish candlestick pattern
- Safe stop-loss level
Higher timeframe analysis
By analyzing higher timeframe, you can filter out 80% of false setups. Because market travels in the direction of trend always. Market makers try their best to make false breakouts against the trend to capture retail traders.
That’s why higher timeframe analysis help to do a technical analysis only in the direction of the major trend. In this case, the higher timeframe trend should be bearish because we are dealing with a bearish flag pattern.
Bearish candlestick pattern (optional)
This is a strategy used to increase the risk-reward ratio. This is an optional parameter because you will only use it when the risk-reward of the actual setup will be below 1:1.5.
According to this strategy, after the breakout of the channel, if the risk-reward is below 1:1.5 then you should wait for the price to do a minor retracement after the breakout. After minor retracement price mostly forms a bearish candlestick pattern. We will then open a sell trade only at the formation of a bearish candlestick pattern because this will increase the RR ratio.
Safe stop-loss level
The safe stop-loss level is always below the 78.6% Fibonacci level. It doesn’t matter either price retraces to 50% Fibonacci level or 61.8% Fibonacci level.
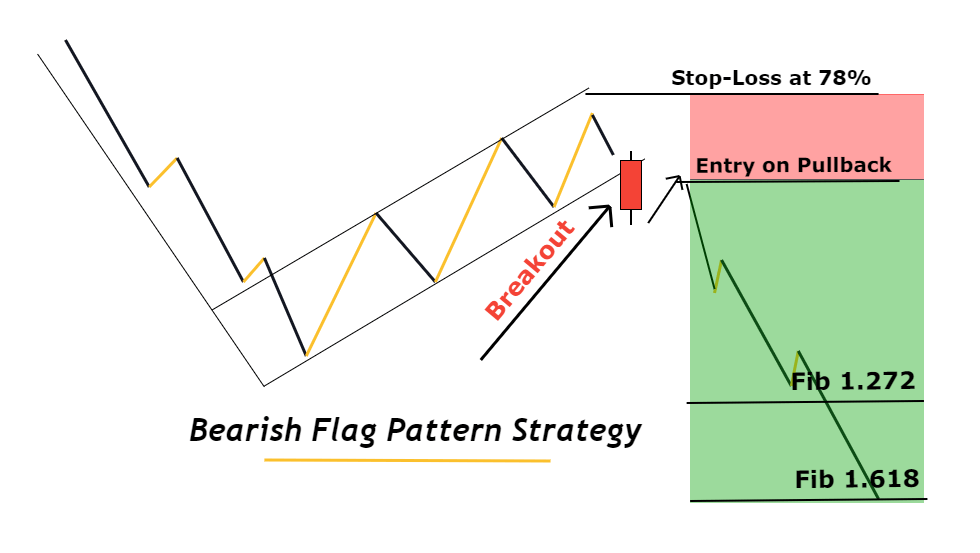
Pro tip: Increase your tp level from 1.272 to 1.618 Fibonacci extension level if price retraces to 50% Fibonacci level.
Conclusion
This is the most powerful method used to trade forex or any other asset. You will also learn to tackle your psychology by learning this method of trading. Because it will decrease the frequency of trades and increase the thinking behind every setup.
Make sure to backtest this strategy properly to master it and then trade on a live account.