
Definition
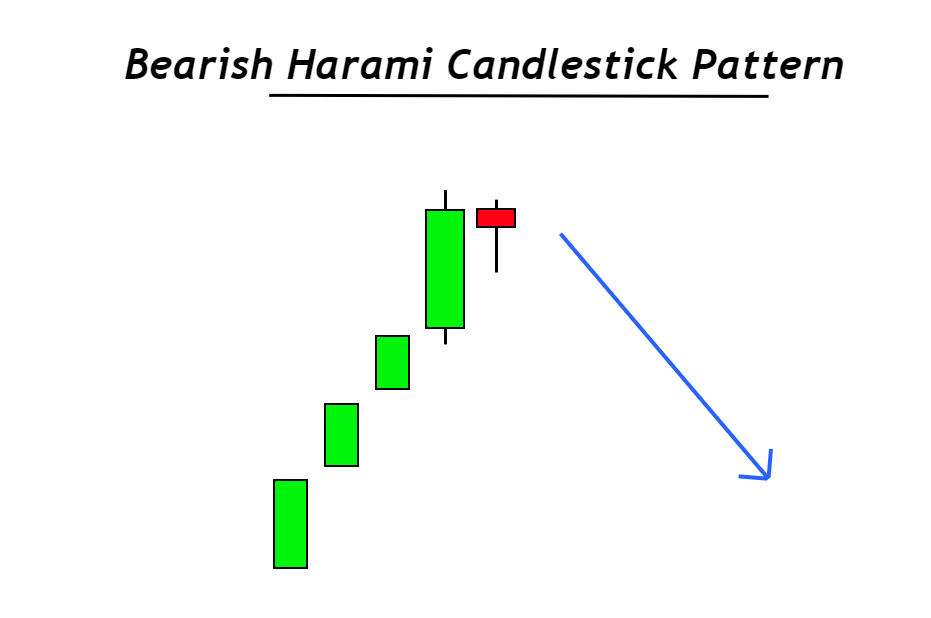
Bearish harami is a bearish trend reversal candlestick pattern that consists of a big bullish candlestick and a small candlestick inside the range of a bullish candle. It is also known as a bearish inside bar pattern.
The retail traders mostly use bearish harami pattern to forecast the upcoming trend reversal in the market. It primarily forms after the bullish trend’s end and signals the start of the new bearish trend.
Jn this post, you’ll learn about the bearish harami pattern in detail with a profitable trading strategy. So read the full post carefully and practice to become a better trader.
How do you identify bearish harami candlestick patterns?
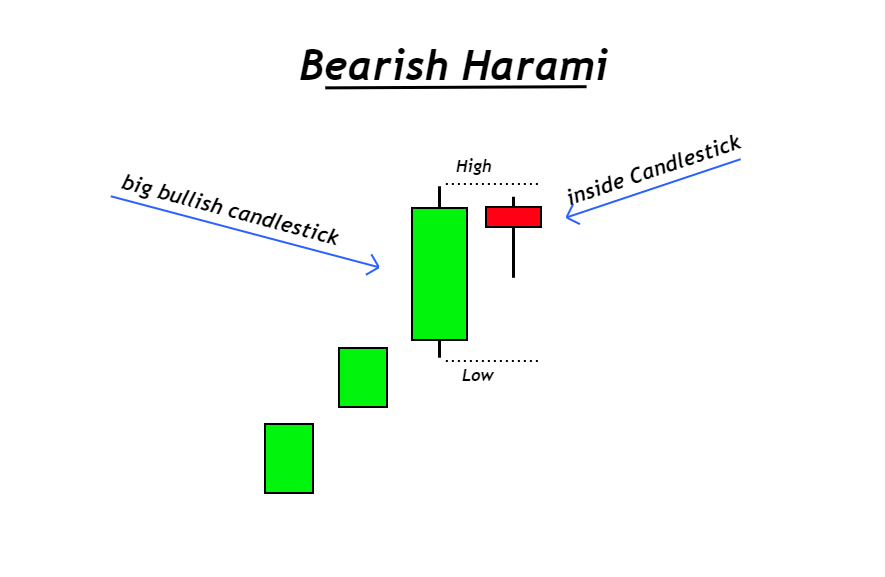
The bearish harami pattern consists of two candlesticks. The structure of candlesticks determines the Quality and winning probability of this bearish harami candlestick pattern. That’s why I have explained some rules you can use to identify bearish harami patterns correctly.
- The first candlestick will be bullish. The body-to-wick ratio of this candlestick should be more excellent than 60%. It means it should have a large body as compared to its shadows.
- The second candlestick will be small. It will form within the range of the previous bullish candlestick. It means a lower high and higher low trend will form.
These two steps will help you filter high-probability candlestick pattern from the crowd. Because the price chart is always full of noise, traders find it challenging to tackle the noise due to psychological effects. So if you make rules, you can find high probability patterns.
Location of bearish harami pattern
This is the most important step of the bearish harami pattern. Because without this, you’ll not be able to make profitable trades.
This important step is the location of the harami candlestick pattern. So a bearish Harami pattern must form at the end of a bullish trend or during overbought conditions.
- The prior trend before this candlestick pattern should be bullish.
- Price should be in overbought conditions during the bearish harami candlestick pattern formation.
You need to avoid the following two conditions while finding a bearish harami pattern on the price chart
- It should not form after a downtrend
- It should not form during ranging market conditions

Find High Probability Trades with this ADVANCED Candlestick Patterns Course
The Ultimate Candlestick Patterns Course That Will Help You To Trade Better
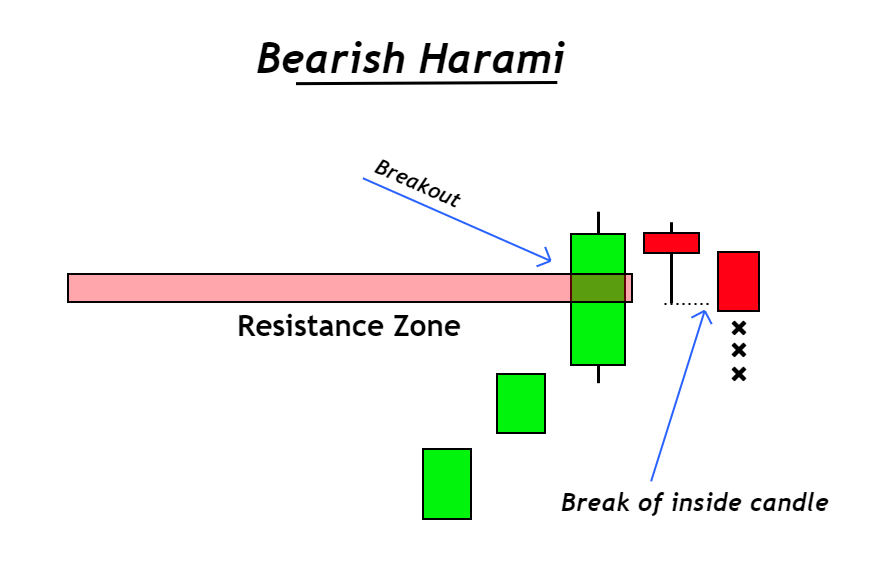
Breakout of inside candlestick
The formation of a small candlestick inside the range of the previous candlestick shows the phenomenon of indecision. So breakout of the inside candle downward confirms the trend reversal. That’s why the inside candlestick should break in a bearish direction, and a bearish harami pattern will form.
Before breakout, this pattern will be just a harami pattern.
What does the bearish harami pattern tell traders?
A technical trader only follows the price patterns to predict the future price trend. But it is mandatory to learn the psychology behind every price pattern because it will help you make better trading decisions.
The main point to learn here is that you should know the activity of big traders behind the candlestick chart. So how to do that? Let’s understand the psychology behind the harami candlestick pattern.
When a bullish trend enters the overbought region, there are many chances that the price will take a bearish trend reversal. Because this is nature, when the price goes up, it will certainly come back after some time. Price moves in the form of cycles.
So chances of bearish trend reversal increase at the end of a bullish trend or during overbought conditions. Now the inside candlestick form after a big bullish candlestick shows that after a big key level breakout (with a big bullish candlestick), the price is deciding its future direction (indecision due to the inside candle). So when the price breaks the low of the inside candlestick, it shows that price has decided a bearish direction.
Overbought conditions and the Bearish harami pattern both show bearish trend reversal. So the probability of a bearish trend will increase, resulting in a winning trade.
That’s why you should focus on reading the price.
Bearish Harami pattern trading strategy
The strategy that I’m going to teach you here is a pure price-action-based strategy. However, if you’re a newbie or intermediate trader, you can also use the RSI indicator as a confluence.
It is a sell-trade strategy, which means you’ll only open sell trades with this.
It consists of the following confluences:
- Daily timeframe trend: it should be bearish
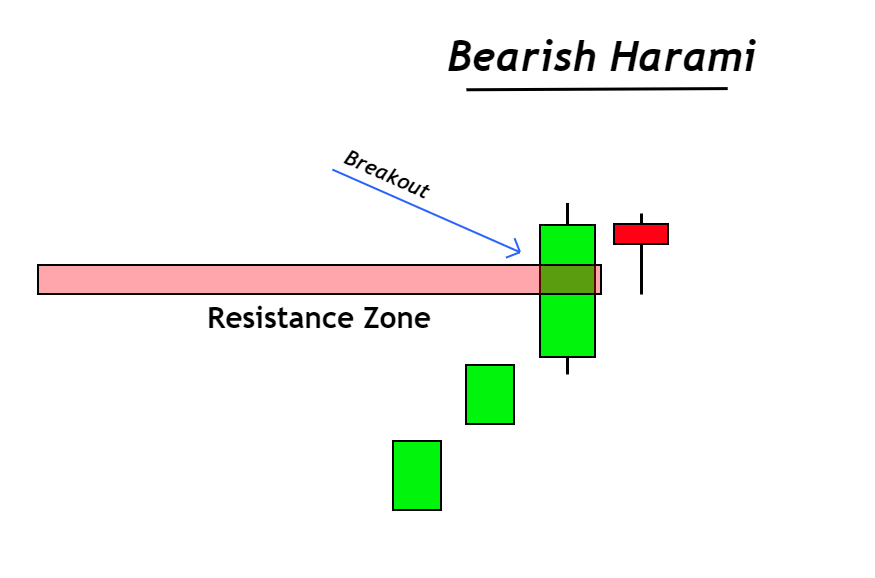
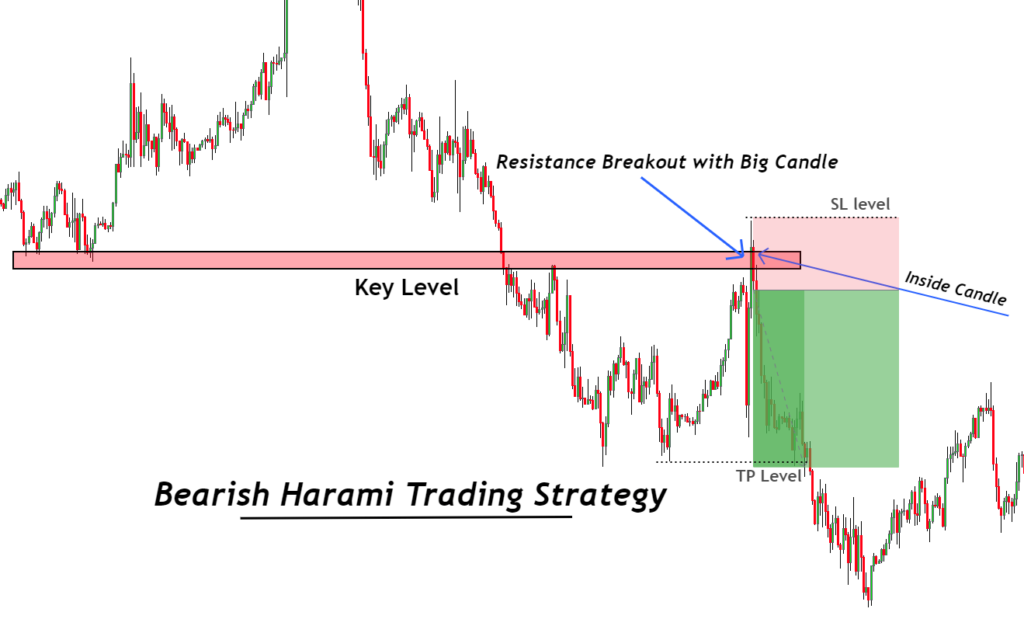
- Key resistance level: the big bullish candlestick should break a certain resistance level.
- Breakout: the inside candlestick should break in the bearish direction.
- Overbought conditions: you can also use price action techniques to identify overbought conditions. However, for intermediate traders, I will recommend using the RSI indicator. It should be above 70.
Open a sell trade
The first step is to check the daily trend, which should be in a bearish direction ( price will form lower lows and lower highs). Then find a bearish harami pattern at a key resistance level.
Open a sell trade on the breakout of the inside candle, then place a stop loss above the high of the bullish candlestick or above the resistance zone.
Set the take profit levels to 61.8 Fibonacci and the low of the previous bullish wave
Final words
Bearish harami is the best candlestick pattern, and I also use it for forecasting purposes. It’s one of my favorite candlestick pattern. I will also recommend you use this pattern to check trend reversals.
However, it is best to use this pattern on lower timeframes like 1M and 5M. It can be used for Swing trading and intraday trading. Daily and Weekly timeframes form very high probability bearish harami patterns.
Make sure to backtest this candlestick pattern at least 100 times to master it. This pattern is going to help you a lot in trading.