Bearish candlestick patterns refer to candlestick patterns that forecast a reversal in trend from bullish to bearish in forex technical analysis. Candlestick patterns are mainly used to confirm a reversal in trend. In simple words, if a currency pair is overbought then a bearish candlestick in this currency pair confirms that trend is now about to change.
There are a lot of bearish candlestick patterns but here only the top and best three candlestick patterns will be explained. No need to make things complex. We have filtered the three best bearish candlestick patterns that will work.
Best three bearish candlestick patterns are following
- Bearish pin bar
- Bearish Engulfing candlestick
- Evening star pattern
There are many ways to trade candlestick patterns. You cannot trade with a single candlestick pattern because candlestick patterns do not tell us about the target price. How far price will go? We do not know. For that purpose, we do technical analysis using chart patterns.
Candlestick patterns can be used in the following four ways
- weakness or strength in the market
- the upcoming reversal in trend
- do not give a target price (take profit)
- used as a confirmation to place an order
Bearish pin bar
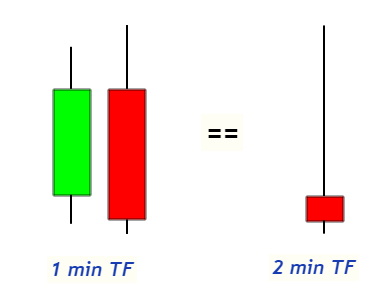
A bearish pin bar refers to a candlestick that has a long upper wick and a small body at the bottom. It forecasts a reversal in price trend from bullish into bearish. The pin bar is the most powerful candlestick pattern in forex technical analysis.
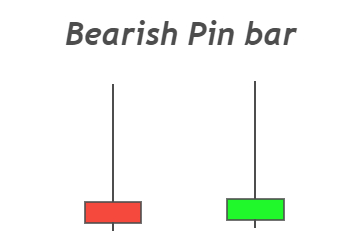
- Body and bearish pin bar must be less than 25% of total candlestick size.
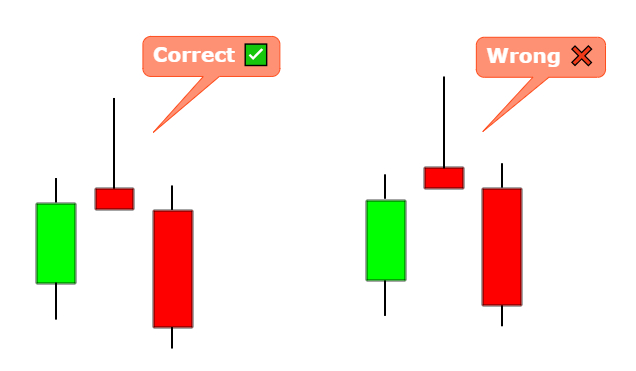
- The closing price of the pin bar candlestick must be within the range of the previous bar.
- Pin bar color does not matter but the location of the candlestick matters. Like the formation of a bearish pin bar at a strong resistance level.
How to trade bearish pin bar
Here I will explain a simple trend following strategy using three technical analysis tools.
- Trend
- Fibonacci tool
- Bearish Pin bar
The first step is to look for a bearish trend (formation of lower lows and lower highs). Then the next step is to draw the Fibonacci tool on the recent wave and highlight Fibonacci 0.618 and 0.5 levels. In the end, look for a bearish pin bar pattern at highlighted zone.
Place an order just after the formation of a bearish pattern. The stop-loss price will be above the high of the pin bar pattern or above the zone (go with the safest option). Target will be measured using the Fibonacci tool. Take profit price will be at Fibonacci extension level 1.272.
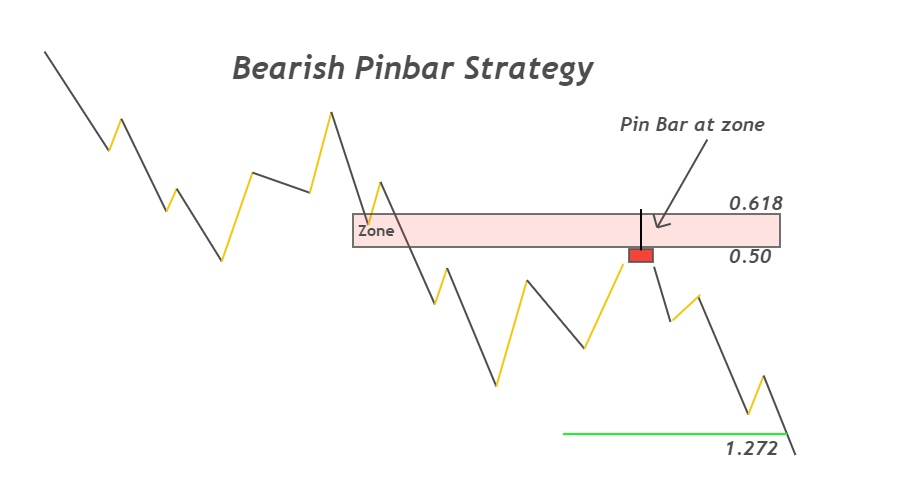
Always remember to pick setups that have a good risk reward ratio.
Bearish engulfing pattern
Bearish engulfing pattern refers to the formation of higher high and lower low in a specific timeframe. As the name suggests, the most recent candle fully engulfs the previous candle. Engulfing pattern consists of two candlesticks. The most recent candlestick forms a higher high and a lower low in case of engulfing pattern.
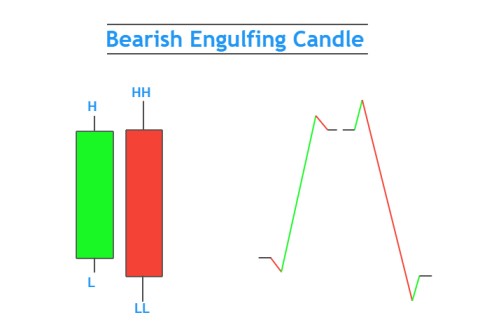
Criteria for bearish engulfing candlestick pattern is
- Body size of recent candlestick must be above 75% of total candlestick size (from high to low)
- The previous candlestick must be a bullish candlestick.
How to trade bearish engulfing candlestick
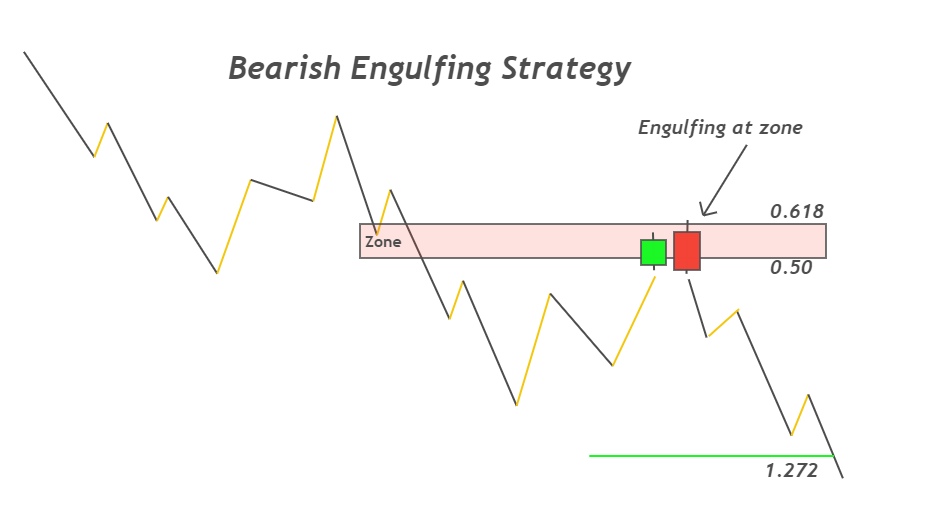
The strategy to trade the bearish engulfing pattern is the same as explained above in the pin bar section. The difference is the formation of a bearish engulfing pattern in place of a bearish pin bar candlestick.
I will show you graphically to save your time. you can ask any question in the comment section.
TIP:
If the most recent candlestick (in case of bearish engulfing candlestick) closes below the low of the previous candlestick, then it will be a more powerful bearish engulfing pattern.
Evening star pattern
Evening star candlestick pattern consists of three candlesticks, a bullish candlestick, a spinning top/doji, and a bearish candlestick. It forecasts a reversal in trend from bullish into bearish. It indicates that bears are coming, and bulls are weakening. evening star candlestick is a powerful reversal candlestick pattern when it forms at a strong key level.
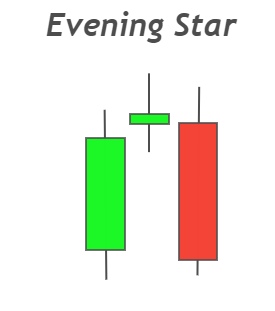
Criteria to identify an ideal evening star pattern is following
- Body of bullish candlestick must be above 70% of total candlestick size (from high to low)
- Body of spinning top / Doji candlestick must be below 25% of total candlestick size. (Remember doji candlestick has almost the same opening and closing price)
- Body of bearish candlestick must be above 70% of total candlestick size.
To trade evening star pattern, strategy is the same as pin bar just replace pin bar candlestick with evening star pattern.
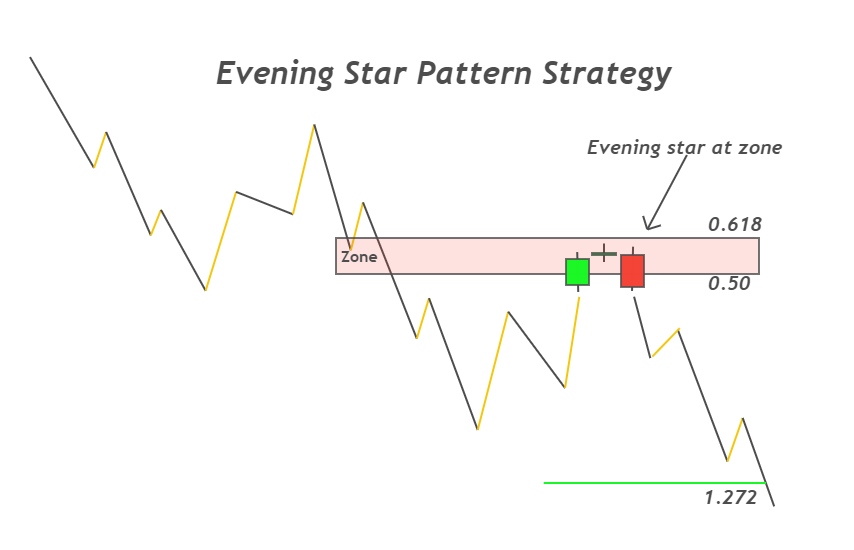
Trend following is very important. Fibonacci is the best natural tool in technical analysis. Candlestick patterns are important to detect a reversal. We have used these three tools to make a simple strategy.
Money is just something you need in case you do not die tomorrow.
Yvan Byeajee
I hope you will like this Article. For any Questions Comment below, also share by below links. Tradingview is the best chart tool
Note: All the viewpoints here are according to the rules of technical analysis and for educational purposes only. we are not responsible for any type of loss in forex trading.

