
Introduction
Nowadays, many supply and demand indicators are available in the market. Those indicators also draw demand and supply zones but without a clear and valid logic.
Supply and demand are essential tools a retail trader uses to analyze the market. But if you’re using the wrong methods to analyze the market, you are losing your time and money.
In this review, I will explain the valid points of supply & demand trading. And at the end of the review, you will get the best supply and demand indicator that works on the advanced concepts of supply & demand.
Definition
The supply and demand indicator is a technical indicator that draws the demand zone and supply zone based on four advance price action patterns.
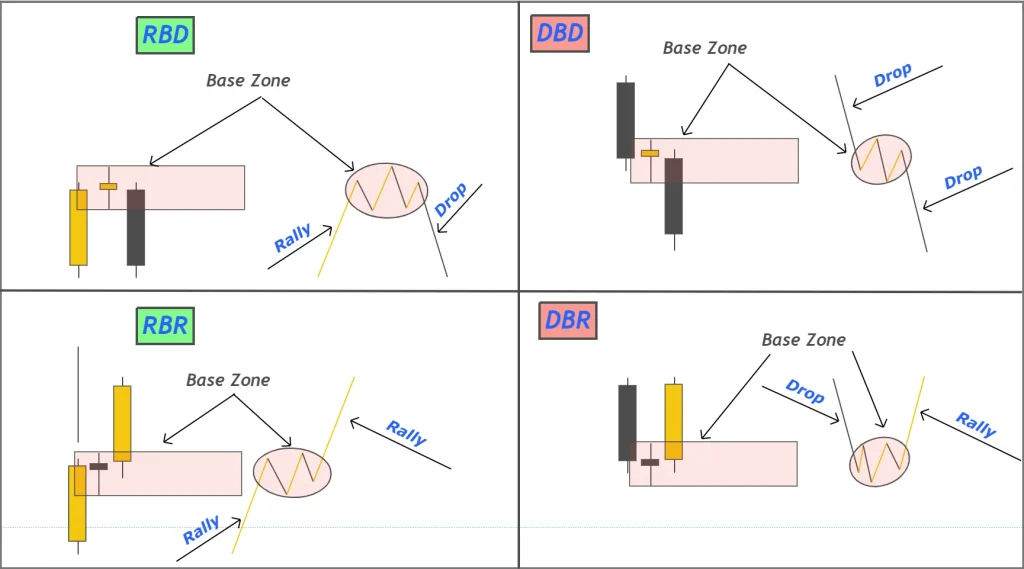
These four patterns are following:
Rally base rally and drop base rally give rise to the formation of demand zones, while drop base drop and rally base drop makes supply zone.
So, if a supply and demand indicator uses these two natural patterns to draw the zones, then that indicator is drawing valid zones.
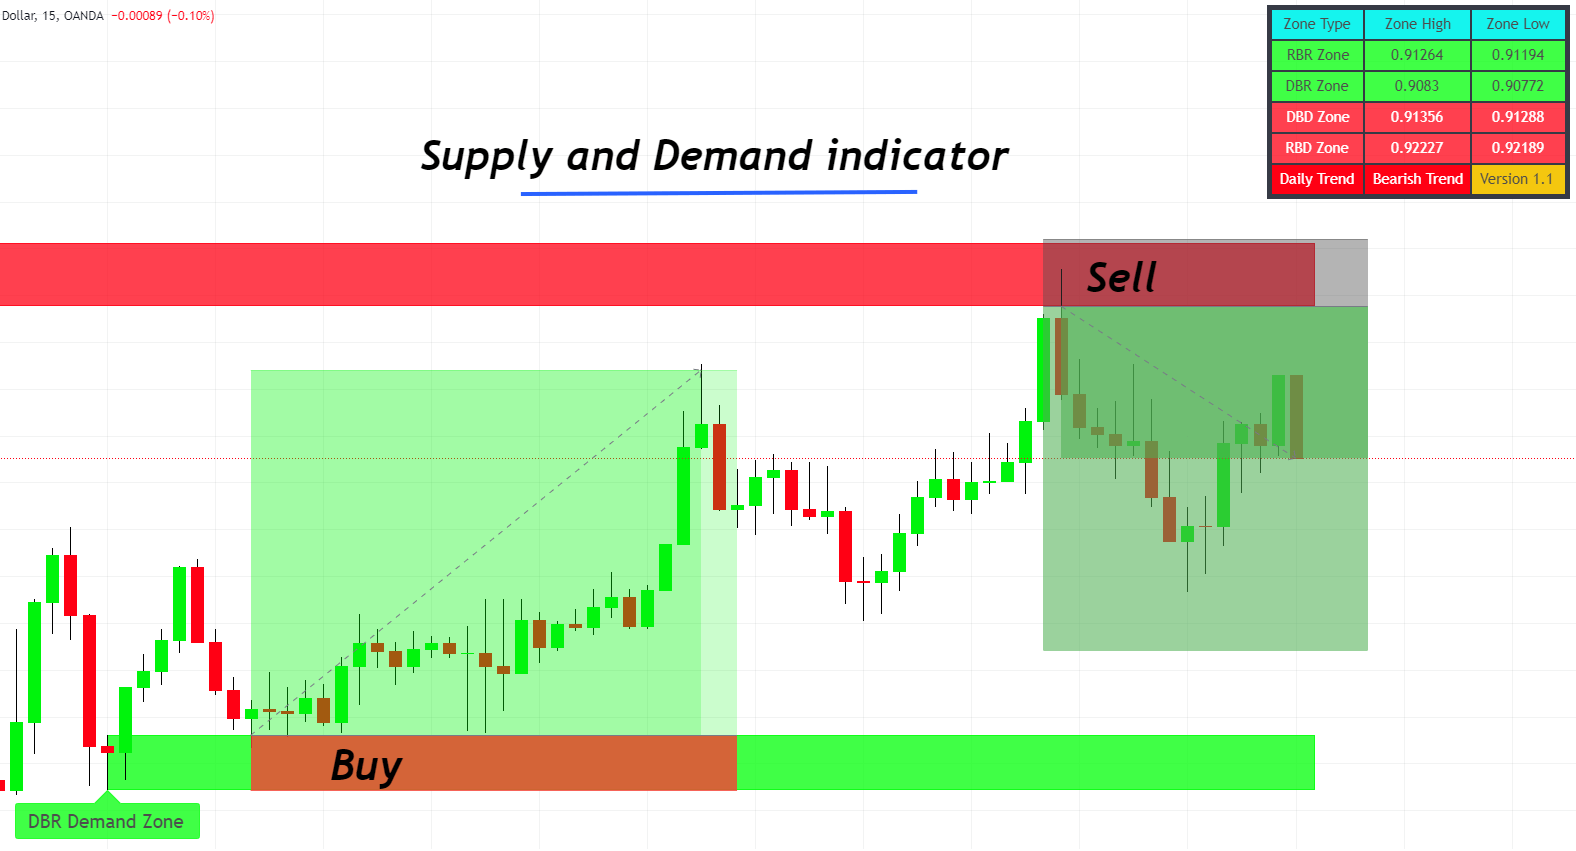
How does the supply and demand indicator work?
It works by making high probability zones on the candlestick chart. Price always moves from one zone to another zone. This indicator picks only high probability zones. It is impossible to draw all the zones on the candlestick chart.
The rally base rally pattern consists of three portions a rally candle, a base candle, and a rally candle. The zone is always drawn on the base candlesticks. You can also look at the image below to better understand this price pattern.
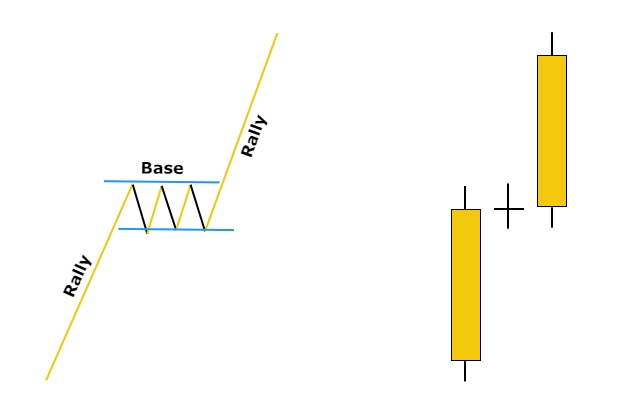
In the same way, the other three patterns work. Keep in mind that the zone is always drawn on the high and low of the base candlestick.
Read this supply and demand trading post if you want to go deep into these patterns.
Features
In trading, risk management is the most crucial factor after technical analysis. If you are not following a proper risk management strategy, you will most likely lose your capital.
The ultra-high risk-reward ratio is the feature of the supply and demand indicator. Because sometimes, you will get such high-risk reward ratio setups that you can gain even 20 to 30% in a single trade.
I will also explain to you with an example to trade with supply & demand.
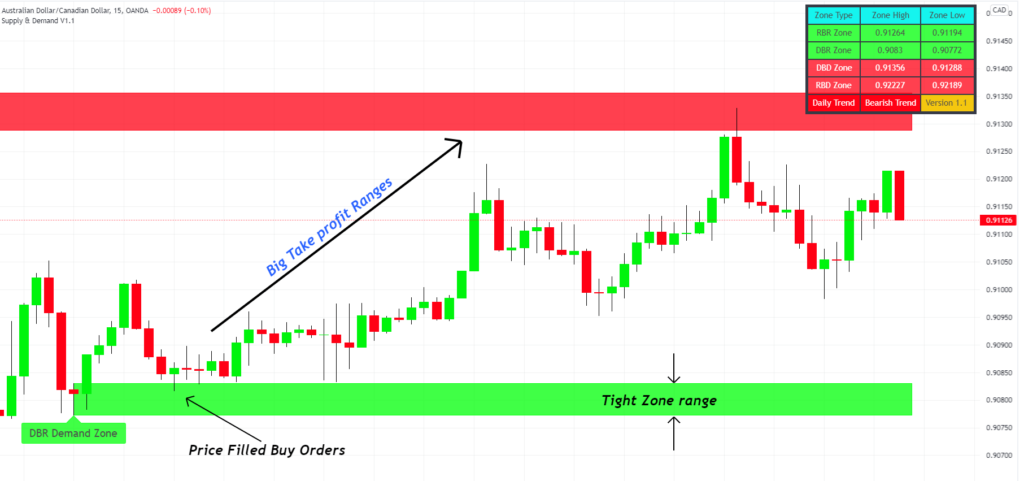
The second feature is the tight stop loss. Because small size zones with fixed high and low forms in case of supply-demand. This is not the same as the support/resistance zones that don’t even have a fixed boundary.
With a tight stop loss, you can gain higher risk-reward trades.
For example, if you open a trade by investing 1% in the demand zone, you gain 8% in a single trade. Then in the future, if you lose even seven trades, you will still be profitable. This is the magic of risk management with supply and demand.
What is the difference between conventional and advanced supply-demand indicators?
The main difference between the conventional and advanced SD indicator is the logic or price action pattern behind it.
Let me explain to you in detail
When the price goes up, it means demand has been increased, whereas when price goes down, it means supply has been increased. This is the fundamental concept. And conventional indicators use this simple method to draw the supply-demand zones on the chart.
Suppose an indicator draws a zone based on price increase or decrease. Then it does not mean the future price will respect those price levels again. This is the lagging concept, and I will also call such type of indicator a lagging indicator.
On the other hand, if a supply and demand indicator draws a zone based on the above four price action patterns (RBR, RBD, DBD, DBR), that is a leading indicator. Because price respects those zones, institutional traders place their pending orders at these zones. This concept has also been backtested by me successfully, and it works well.
Why should you use the supply and demand indicator?
The essential thing to do in trading is to forecast the market using technical tools by following the big institutions and retail traders. Banks have the power to move the whole market, so we should better try to move on their footprints.
So, the supply and demand indicator plot those zones that are under the attention of banks and big traders. They place their pending orders at these zones. So, prices always move forward by filling those pending orders. The orders of institutions can not be filled at once due to volatility issues. That is why they place orders at different zones. And Supply and Demand indicator finds those zones.
How to trade with the supply and demand zone indicator?
Trading with supply and demand is easy, but you can develop your complete trading system using supply and demand zones.
The simplest method is to buy from the demand zone with a stop loss below the zone and sell from the supply zone with a stop loss above the zone. You can use other technical tools like Renko charts or other trend filters to take profit levels.

Access to the supply-demand indicator
I highly recommend you check out this indicator because it is based on advanced technical concepts of supply and demand. Another good feature is the updates because the team is properly working on this indicator to improve its performance over time.
You will get alerts on mobile to avoid missing any trade opportunities. This is not an automatic system, but it is a semi-manual system. It means it works by human decisions and machine intelligence.
Get Access to SUPPLY AND DEMAND INDICATOR
Conclusion
Supply and demand is the base of trading any asset around the world. Whenever demand increases, then price increases, while when supply increases, price decreases. This is the most basic rule of trading, and This supply and demand indicator has used this simple technical analysis to profit from the market.