
Definition
Bid on volume indicator shows the number of orders placed by the traders at the bid price in a specific time interval. It is denoted by the BVol indicator.
Knowing the number of order or contracts help predict the direction of the bullish trend. Retail traders use the bid volume indicator in stocks to find the frequency of trading in a specific time interval so that they can know about the high probability price level and buy the dip to profit from the market.
I will explain everything about the Bid volume indicator in this article, including a trading strategy. So make sure to read the full article.
Formula
Bid volume = Total number of transactions at the bid price/time
Here the bid price is the price at which buyers are willing to open a buy trade.
Transactions mean the number of orders opened and closed.
Here is the interval during which the traders process the number of transactions.
Calculations
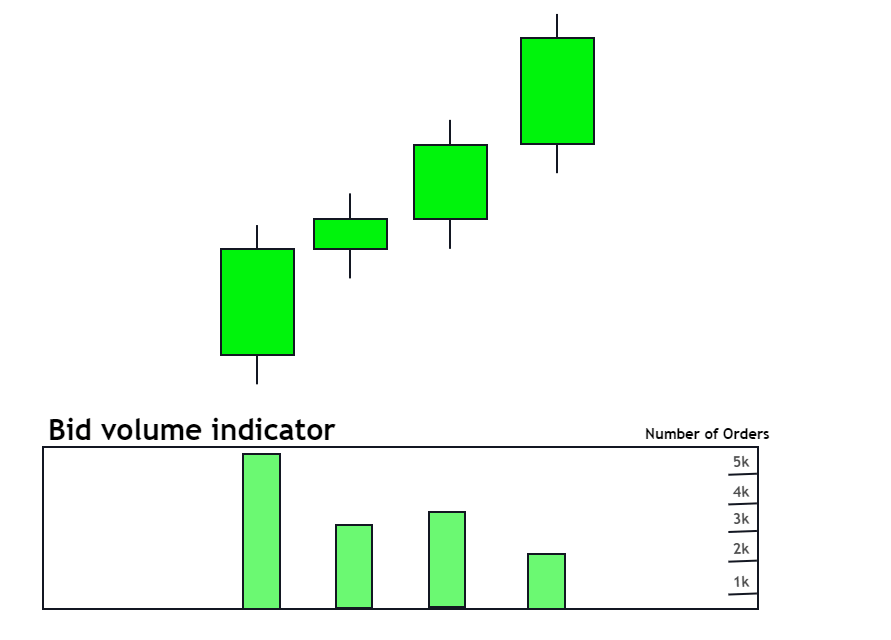
The volume on the bid indicator is straightforward, and the broker provides transaction data. This indicator opens in a separate window and directly shows the number of orders starting from 0 to onward in a specific time interval.
For example, suppose you are analysing the candlestick chart using the bid volume indicator on 30 minutes chart. In that case, the Bvol indicator will show the number of transactions processed during the 30 minutes in the histogram bar.
How to trade with the Bid volume indicator?
Trading in the stock market is slightly different from the stock market. Because volume has much importance in the stock market but not in forex due to the decentralised forex system, that’s why if you’re trading stocks, then the bid volume indicator can prove a helpful tool in technical analysis.
It is obvious in the stock market that when many buy orders are placed at the bid price, it shows buyers’ willingness and interest in the specific price level.
The interest and willingness of buyers are directly proportional to the demand. So when there’s more demand, the price of the financial asset will increase.
The bid volume indicator helps analyse the demand indirectly in the stock market. Because it will show the live number of transactions happening during a specific time interval, this will inform us that there’s a lot of demand at this price. We should also prefer to open a buy trade because the price will increase due to a lot of demand.
You should also make sure that you’re going to buy before consumption of demand. If you’ll buy after the demand is consumed, then there’s a low probability of an increase in the price.
The bid volume indicator also lags a little bit, but still, it’s very helpful in analysing different price levels.
For example, if you see a huge bid volume at a specific price, you can also trade that price level in future when the price returns to that level.
What is the difference between bid volume and ask volume?
The bid volume shows the number of orders placed by buyers in a specific interval of time. However, the ask volume represents the number of transactions by sellers in a specific interval of time.
The bid volume is plotted above the zero line in green color while the ask volume is shown in red color and below the zero line. Some indicators plot both bid and ask volume in a single window.
The bottom line
I will not recommend the bid volume indicator to forex traders. However, stock traders should surely use this indicator in technical analysis because the whole market relies on supply and demand. The bid volume indicator is an indirect way to find the demand on the price chart.