
Definition
The Breakout indicator is a technical indicator that shows support and resistance breakout zones on the price chart.
It is difficult for traders to manually identify breakout zones on the chart of 28 currency pairs. Because sitting in front of the screen all the time is not possible. Also, it is not suitable for health
So, you need an indicator that will find breakout zones for you. And then you can trade those setups manually.
It is not recommended to rely on the indicator entirely. But it would be best to use indicators to minimize the screen time. It will also improve psychology.
In this article, I will explain the working of the breakout indicator, and at the end of the article, you will get the link to that indicator.
What is a breakout in trading?
Breakout in trading represents the break of strong support or resistance level in technical analysis. When the support zone breaks, a bearish trend starts, while a bullish trend starts on the breakout of the resistance zone.
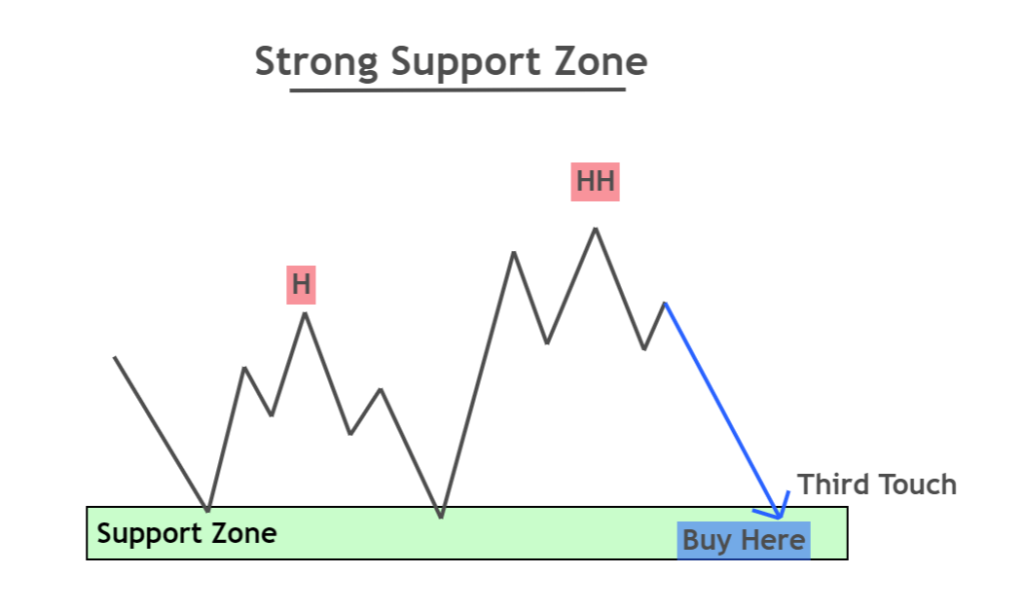
Support zone
It is a zone of price levels that are under the attention of buyers, and most traders tend to buy from these price levels. It is called a support zone.
When the price breaks the support zone, it shows that sellers have overcome the forces of buyers, and now a bearish trend will start.
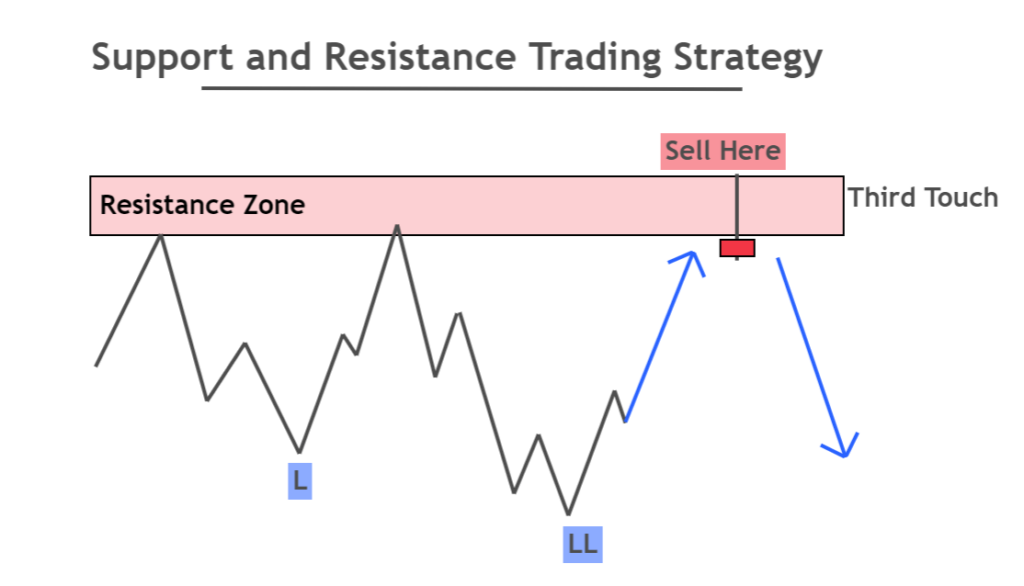
Resistance zone
It is a zone of price levels under sellers’ attention, and most of the trade tends to sell from these price levels. It is called a resistance zone.
When the price breaks the resistance zone, it indicates that buyers have overcome the power of sellers, and now a bullish trend will start.
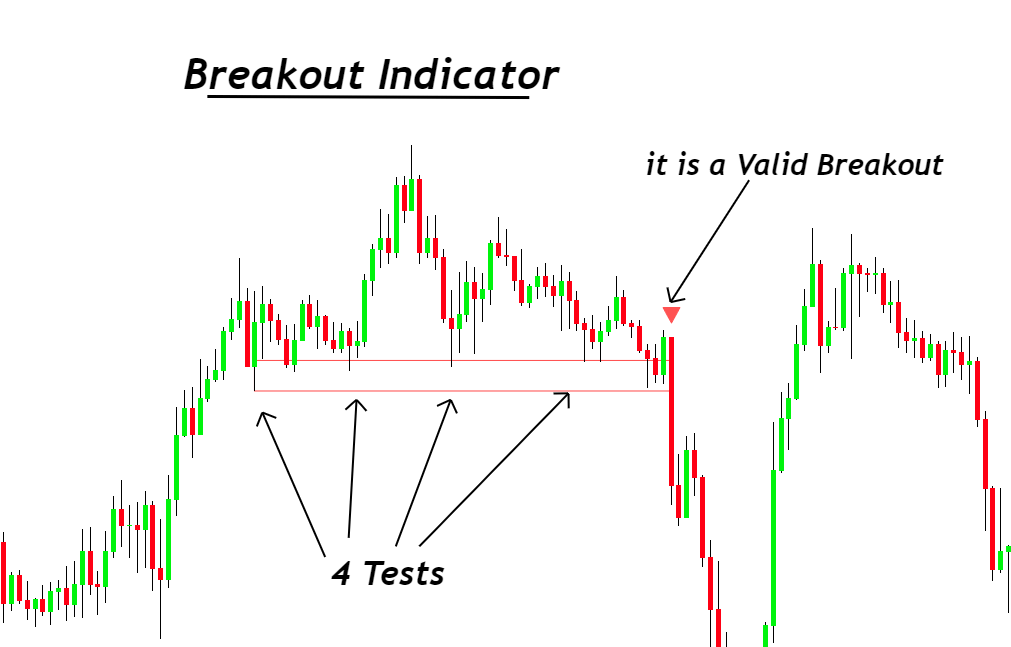
How do you identify a valid breakout?
To identify a valid breakout of support or resistance zone, there must be at least two to three price tests of these zones.
Like in the image below, the price touches the zone two times, and now it becomes a valid zone. When a valid zone breaks, then the price trend changes.
How does the Breakout indicator work?
After getting familiar with the breakout trading, now comes the breakout indicator. It will decrease screen time and offer many benefits like alert function.
Using pivot points and a candlestick closing price strategy, the breakout indicator draws the support or resistance zones on the chart.
The breakout indicator will continue to draw a valid zone until the candlestick closes on the opposite side of the zone. After the candlestick closes, it will stop drawing the zone and alert you about the support or resistance zone breakout.
Look at the image below to better understand the breakout indicator working.
Breakout indicator settings
In the settings of this indicator, you can change different parameters according to your strategy, like the period has the default value of 5. The period is used for pivot points. The threshold rate shows the width of the zone. The minimum number of tests shows how many times the price has tested a zone.
For example, if you want to identify only the strongest zones. you can increase the value of the minimum number of tests.
The most important parameter is the alert function. The indicator will alert you whenever a breakout of support or resistance zone occurs.
How to trade with the Breakout indicator?
Trading with a breakout indicator is very simple. But you can also add this to your strategy to increase the winning probability of a trading strategy.
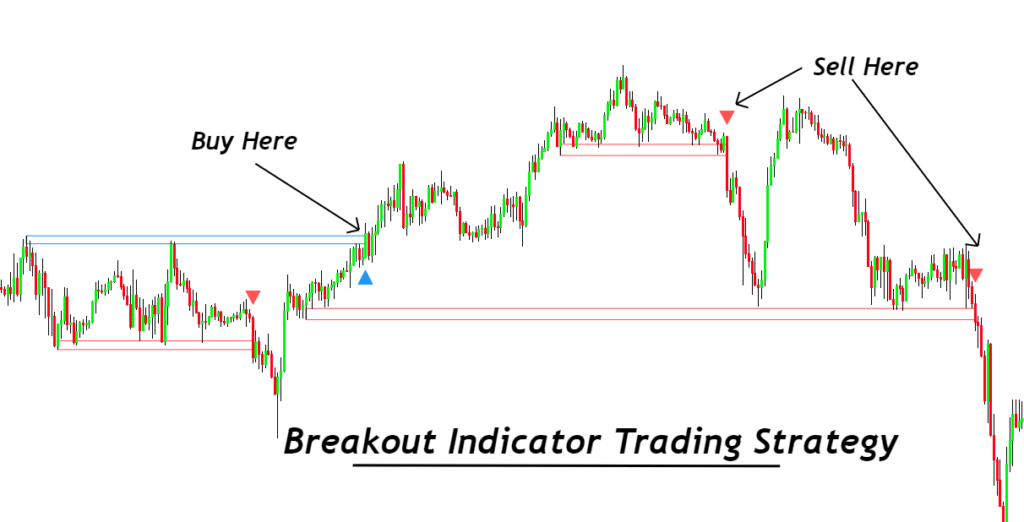
Buy signal
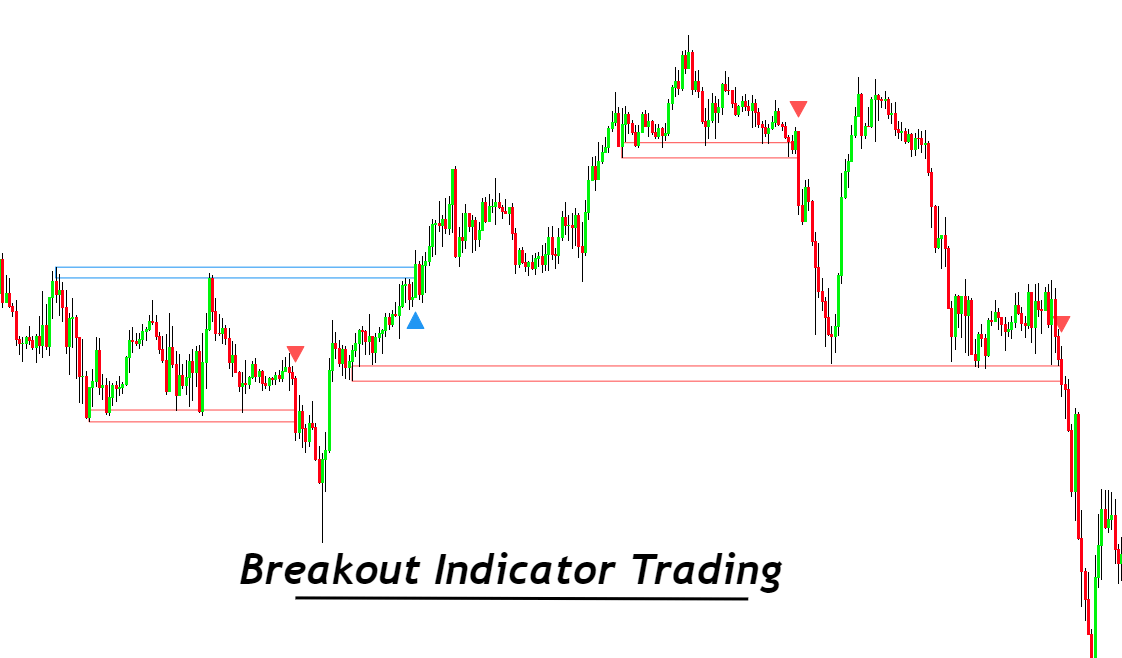
When the price breaks the resistance zone with a big bullish candlestick, the indicator will plot a blue arrow. This shows the buy signal.
You can open a buy order just after the resistance breakout or wait for the price to retrace to open a buy order from the best possible price level. This will increase the risk-reward ratio.
Sell signal
When the price breaks the support zone with a big bearish candlestick, a red arrow will appear showing the sell signal. Open a sell order after the breakout and place stop loss above the last swing.
Here is the link to the indicator
The bottom line
The best trading strategy is to use the indicators to minimize screen time. Because this act will help you improve your psychology, if you will always sit in front of a screen looking for setups, you will not be able to make good decisions in trading.
This breakout indicator helps determine support and resistance breakouts then we can use the predicted direction to align with another price-action based strategy. It will significantly improve the winning ratio.
The indicator is supper
Please how do i know the values of this indicator and how do i get the mql4 of it, ill like to turn it to EA