Definition
The bull flag is a continuation chart pattern that consists of two waves and resembles the shape of the flag in technical analysis trading.
When bullish flag pattern forms on the price chart then it signals that price will continue the bullish trend. It is the most widely used and easy-to-understand chart pattern. The flag pattern has a high winning probability because it only signals in the direction of the trend.
How to identify bull flag pattern?
The bull flag pattern is categorized into two elements
- A pole
- A flag
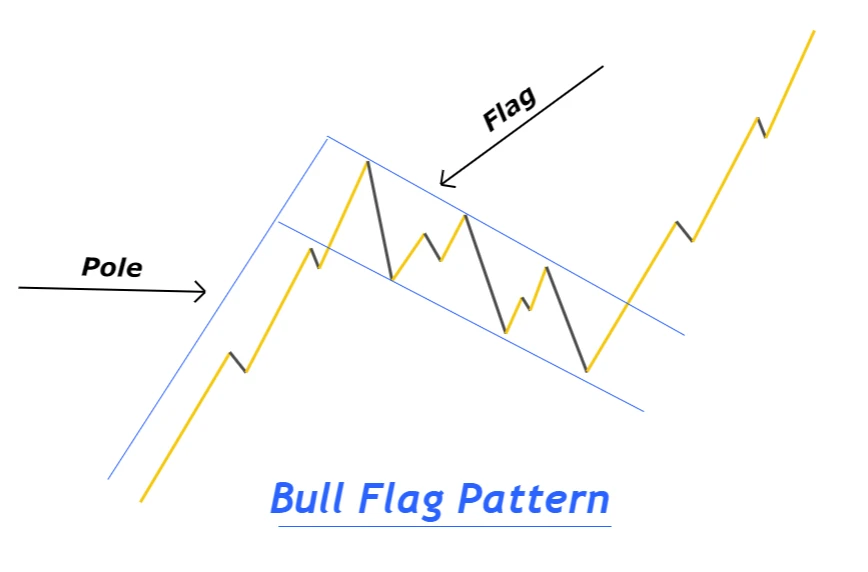
Origin of bullish flag pattern
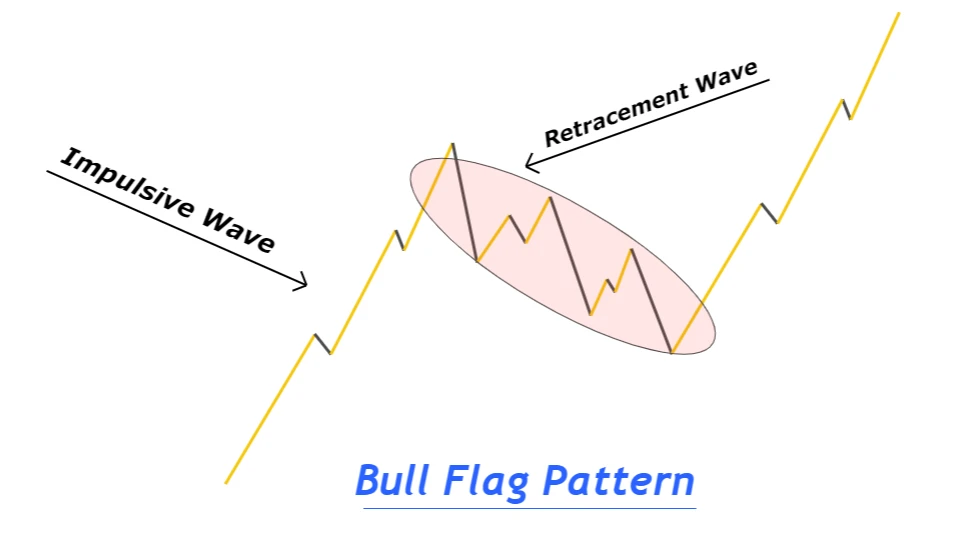
The market consists of two major waves. The first one is the impulsive wave and the second one is the retracement wave. A pole in a bull flag pattern represents the formation of a bullish impulsive wave. A flag in the bull pattern indicates the formation of a bearish retracement wave.
Pattern criteria
But a good flag pattern has a specific criterion that you need to follow to identify a perfect trading pattern.
- The Pole of flag pattern must indicate the impulsive wave
- The flag must show retracement wave. a retracement wave can consists of further two or three smaller waves. So to draw flag pattern, you should identify at least two smaller waves within retracement. Then draw a channel meeting the highs and lows of retracement
- The breakout of channel must be with a big body bullish candlestick
- Price should not retrace below the 61.8% Fibonacci level. If price retraces to 78.6% Fibonacci level then it means the bullish trend is weak. so we will skip that setup
What does flag pattern tell traders?
As the market consists of two phases
- Impulsive phase
- Retracement phase
After the impulsive phase, the retracement phase must happen or after the retracement phase, the impulsive phase must happen. Retracement on the chart is an indication of a big bullish or bearish trend.
In a bullish flag pattern, prices continue retracing downward in the form of a channel. In the retracement, big traders and institutions take profits from the market, and prices keep retracing downward. Market makers want the price to come to a level where they have put their pending orders.
After execution of pending buy orders, the price will break the channel and continue to move upward. After the breakout of the channel, the impulsive phase starts.
Pro Tip: Sometimes a false breakout of the flag will happen. Because market makers don’t want to see the retail traders trade with them.
Trading plan for bull flag pattern
It includes the criteria for stop loss, take profit, risk-reward ratio, and trade entry.
When to open a buy trade
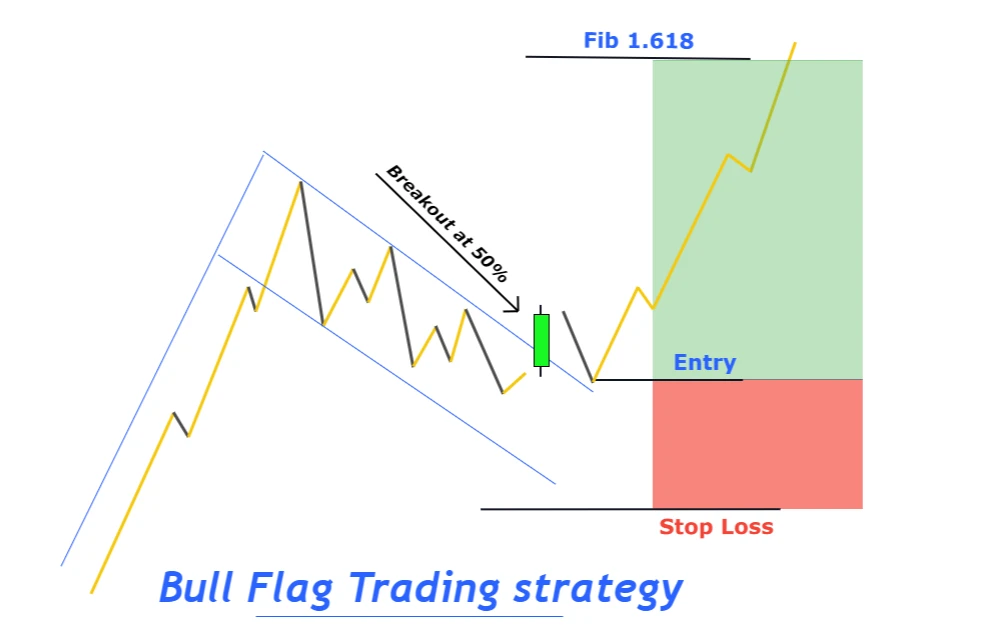
The flag of the bull flag pattern is similar to the shape of a channel. The channel consists of an upper trend line and a lower trend line. A buy signal is generated when the price breaks the upper trend line.
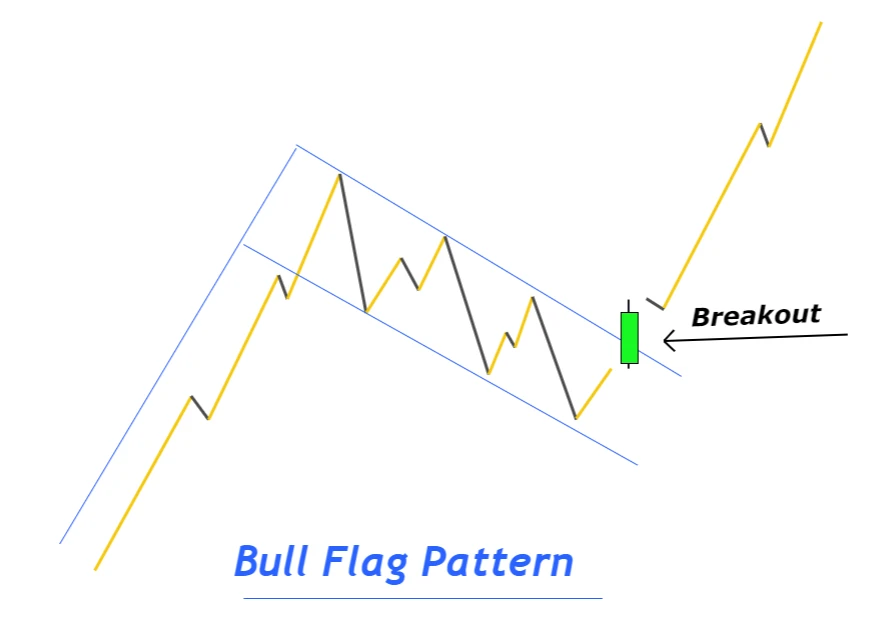
Pro Tip: Breakout of trend line must be with a big bullish candlestick. This is an indication of a valid trend line breakout.
Stop-loss Level
Place a stop loss below the lowest low made by the price after the breakout of the trendline.
Take-profit level
Close half trade at the last higher high made by the price. Apply the Fibonacci tool on the retracement wave and highlight the 1.272 Fibonacci extension level. Close the rest of the trade at 1.272 Fibonacci level.
Risk management
Risk only two percent of the total account balance per single flag pattern trade. The risk-reward should be greater than 1:2. Don’t trade the patterns that offer a low risk-reward ratio.
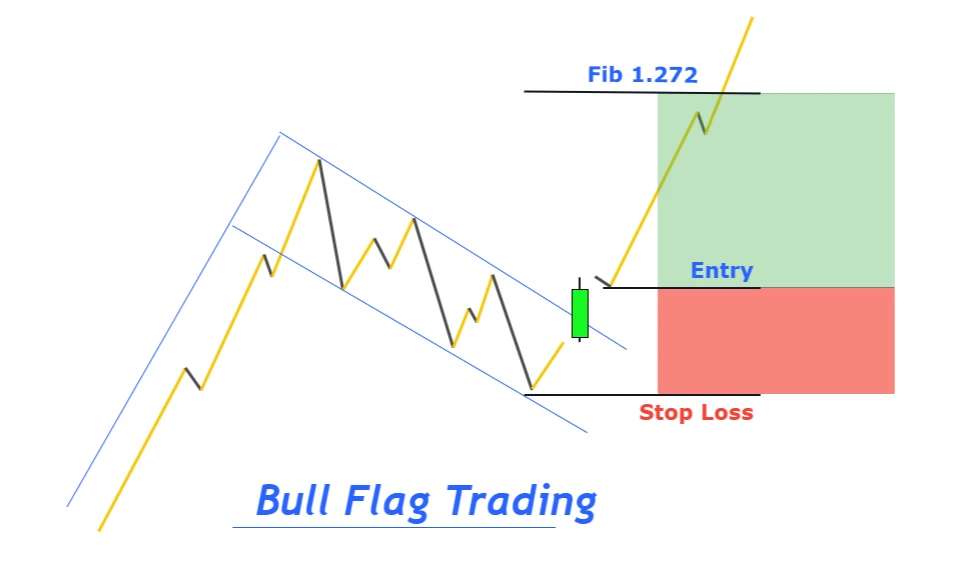
Bull flag trading strategy
I have explained the default trading plan for this pattern but now I will make changes in the trading plan to make a better version of it by adding more confluences.
Confluences to add
- bullish candlestick pattern
- Higher timeframe trend
- Safe stop loss level
Trading strategy
The first and the most important factor you should consider in every trade setup is the higher timeframe trend. Higher timeframe analysis increases the probability of winning in a trade setup. Without higher timeframe analysis, you may go against the trend even with a bull flag pattern.
This is the difficult part of a trade setup for beginner and intermediate traders. I will make it easy for you by explaining a simple technique to identify the higher timeframe trend. But keep in mind that this is for intraday traders only.
Open the daily timeframe chart and highlight the highs and lows of the daily candlestick. The high and lows of daily candlesticks form a trend on the lower timeframe. For example, if there are three bullish candlesticks on a daily timeframe forming a higher high and higher low, then the higher timeframe trend is bullish.
You will have to confirm the bull flag trading plan by this higher timeframe analysis technique.
Confluence of bullish candlestick pattern (optional)
After the breakout of the trendline, the price will retrace a little bit. If you will wait for the price to retrace and then open a buy trade after the formation of a bullish candlestick pattern, then it will increase the risk-reward ratio.
This is an optional confluence, and it depends on the trading environment. For example, you found a bullish flag pattern, but the risk-reward is less than 1:2 then you should wait for the price to retrace.
Safe stop loss confluence
Sometimes the price will retrace to 50% Fibonacci level or close to it then, it is not safe to place a stop loss below 50% or close to it. Stop loss should always be below the 78% Fibonacci retracement level at least.
Pro Tip: if price retraces to only 50% Fibonacci level, then adjust your take profit level from 1.272 to 1.618 Fibonacci extension level.
This is the method of trading a chart pattern.
Conclusion
To survive in trading forex, you should learn to trade with logic. There is always some logic behind every chart pattern or every trading strategy. You cannot master a trading strategy until you will learn the logic behind it.
By learning this method, you will come to know that what’s happening in the market and what’s about to happen in the market.

