
Introduction
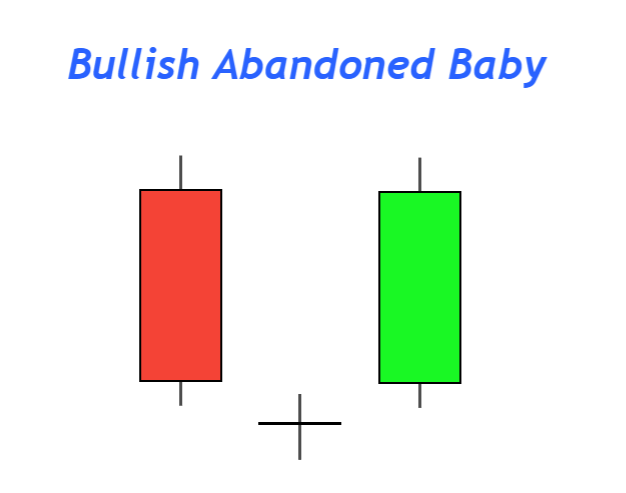
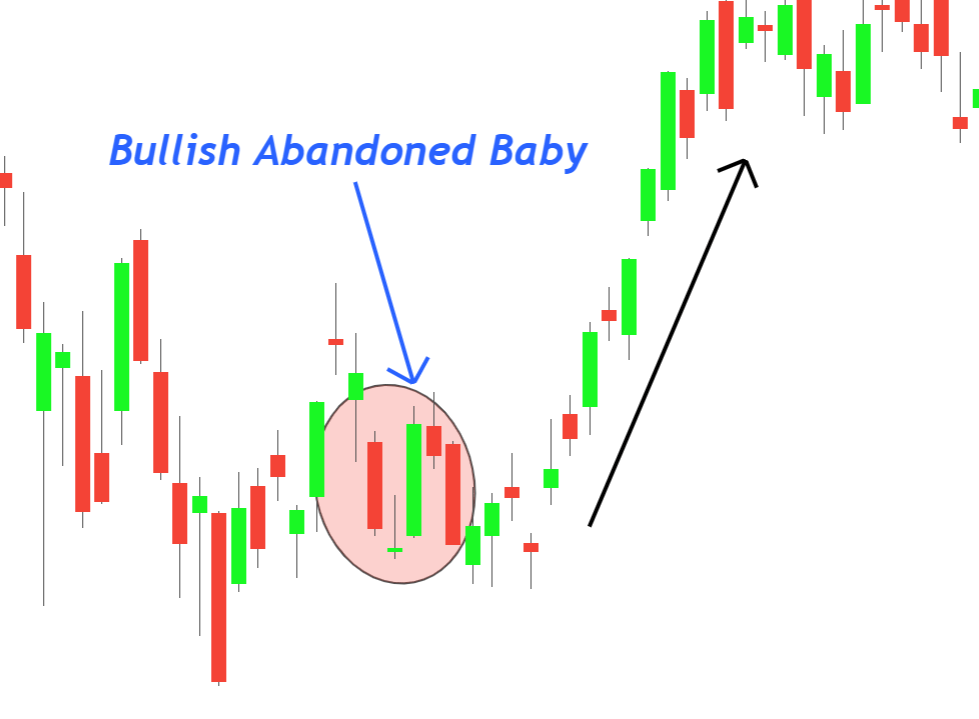
A bullish abandoned baby is a trend reversal candlestick pattern that consists of a bullish candlestick, a Doji with a gap down, and a bearish candlestick.
It is like the morning doji star candlestick pattern with respect to price structure. But there is a difference in the gap of Doji candlestick. This candlestick pattern rarely forms on the price chart. Usually, you will see this pattern in the price chart of stocks and indices.
How to identify an abandoned baby candle?
It is a three candlestick pattern in which candlesticks form in a specific sequence. By making rules, you can decrease the probability of false patterns.
Follow the following rules
- Rule 1: The first candlestick should be a bearish candlestick with a 60% or more body to wick ratio. The previous trend should be bearish.
- Rule 2: A doji candle will open with a gap down, and it should form below the range of bearish candlestick.
- Rule 3: The third bullish candlestick should open with a gap up and have a 60% or more body to wick ratio.
These are the conditions for an ideal bullish abandoned baby pattern. More than one Doji candlesticks can also form after the first bearish candlestick, but the candlestick pattern’s sense will remain the same.
Bullish Abandoned baby: Information Table
| Features | Explanation |
|---|---|
| Number of Candlesticks | 3 |
| Prediction | Bullish trend reversal |
| Prior Trend | Bearish trend |
| Counter Pattern | Bearish abandoned baby |
Technical analysis guide of abandoned baby candlestick
Before trading a candlestick pattern, it is compulsory to understand the psychology of the pattern to make good decisions during trading.
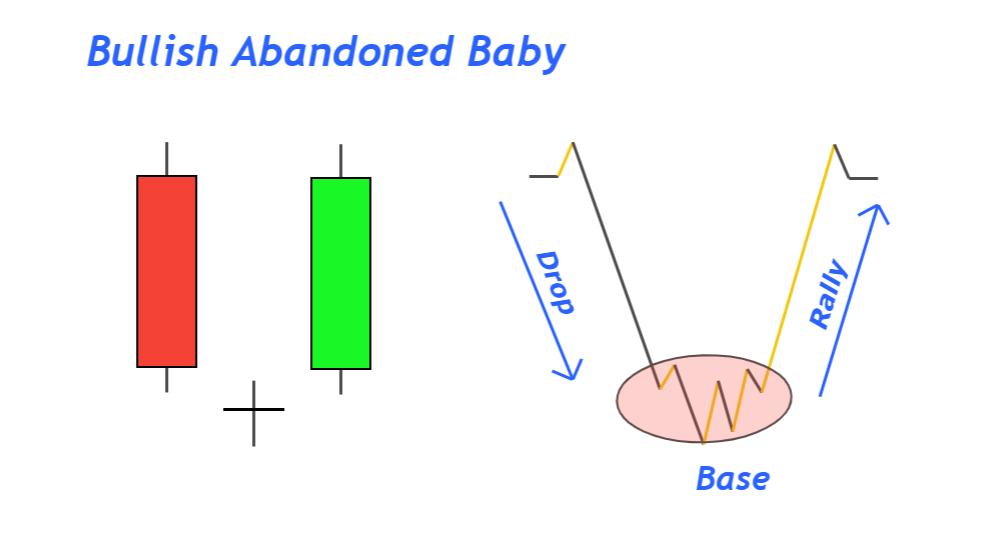
According to rule 1, the bearish trend before the candlestick pattern shows that sellers control. When a significant bearish candlestick forms, it indicates a break of a specific key level.
After the breakout, a Doji candlestick will form with a gap down, showing oversold conditions and a pause in market trend. At this point, the market will be at an indecision point. It can continue its previous trend, or a trend reversal can occur.
The formation of a big bullish candlestick with a gap up after Doji candlestick shows that the market has decided, and now buyers have started controlling the market. Price has closed again within the key level after a false breakout. That is directly a sign of bullish trend reversal.
Now they will increase the price in the future.

Find High Probability Trades with this ADVANCED Candlestick Patterns Course
The Ultimate Candlestick Patterns Course That Will Help You To Trade Better
Best working conditions for abandoned baby candlestick
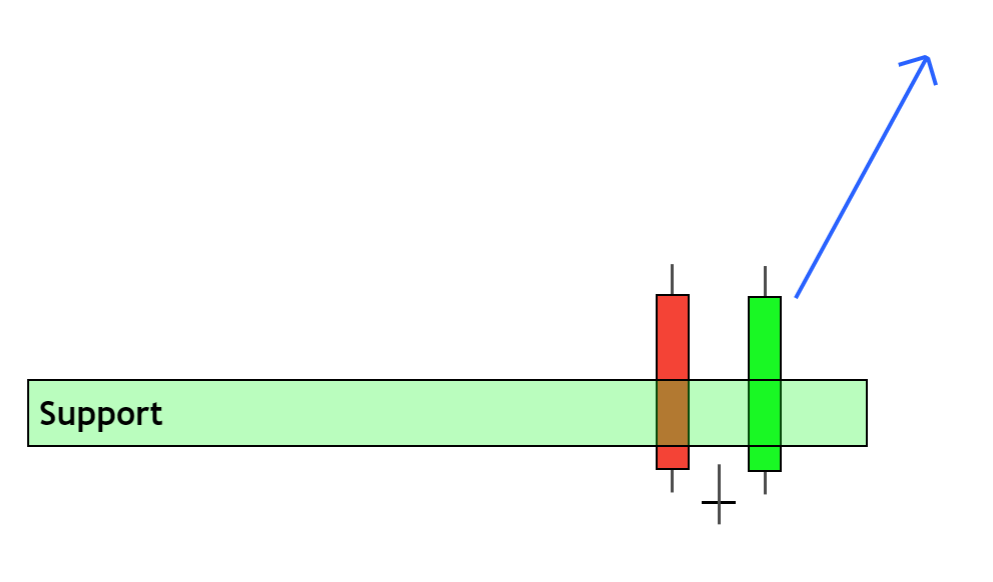
- It should form at support or demand zone
- Oversold conditions will also add power to this candlestick pattern for a bullish trend reversal.
- Do not trade this pattern in ranging market conditions.
Difference between Bullish abandoned baby & morning doji star pattern
The bullish abandoned baby candlestick is similar to the morning Doji star. There is a slight difference in Doji candlestick between them.
- The doji candlestick pattern will open and close with a gap down in the abandoned baby pattern. In contrast, in the morning doji star, doji candlestick will open almost at the same level as the previous bearish candle.
- There can be more than one doji candlestick in an abandoned baby pattern, while the morning doji star has only one doji candle.
Both are bullish trend reversal candlesticks. Abandoned baby candles will usually form in stocks’ price charts and have rare chances in forex price charts.
The Bottom line
Due to very tight conditions, it isn’t easy to find this trading setup in forex currency pairs. That’s why it is advised to trade this candlestick pattern in stocks and indices.
In forex, it can be used to check the trend reversal only. I will not recommend making a trading strategy based on a candlestick with a very low probability of formation on the chart. However, it can be used in many other valuable ways, like it can help you check trend reversal points, help you to analyze a currency pair, and adjust stop-loss levels.