
Definition
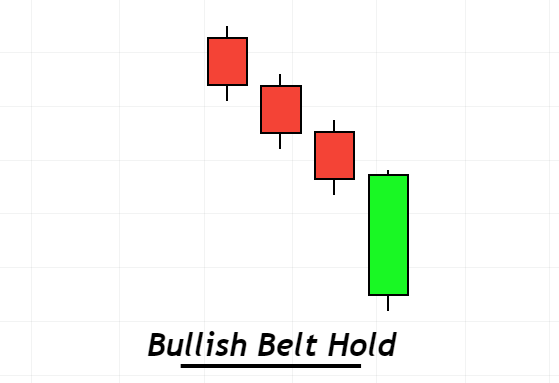
Bullish belt hold is a candlestick pattern in which after three consecutive lower lows, a big bullish candlestick opens with a gap making a new lower low and then closing within the range of the previous candlestick. The bullish candlestick should have a small wick on the upper side and no wick on the lower side of the candlestick.
It is a trend reversal candlestick pattern that turns a bearish trend into a bullish price trend. The belt-hold pattern usually works in stocks and indices. There is a very low probability of the belt-hold in forex trading major currency pairs because of high volatility.
How to identify a bullish belt hold pattern?
To find out belt hold candlestick pattern on price chart, follow the following steps
- Find out three bearish candlesticks making lower lows consecutively on the chart
- After three lows, a bullish candlestick opening below the low of previous candlestick and then closing within the range of previous candlestick
- Bullish candlestick should have small shadow on upper side and no shadow on lower side. It must have wide range than average of previous three candlesticks. It should not be a small bullish candlestick
These are three parameters to find a belt hold candlestick on the chart. Basically, it is a single candlestick pattern but the previous three candlesticks are conditions for optimum performance in trading.
Bullish Belt Hold: Information Table
| Features | Explanation |
|---|---|
| Number of Candlesticks | 4 |
| Prediction | Bullish trend reversal |
| Prior Trend | Bearish trend |
| Counter Pattern | Bearish Belt Hold |
What does bullish belt hold candlestick tell traders?
To trade a candlestick pattern, it is the best practice to know the reason behind the formation of a price pattern on the chart. Because the reason will make you capable of taking correct decision while trading stocks or forex.
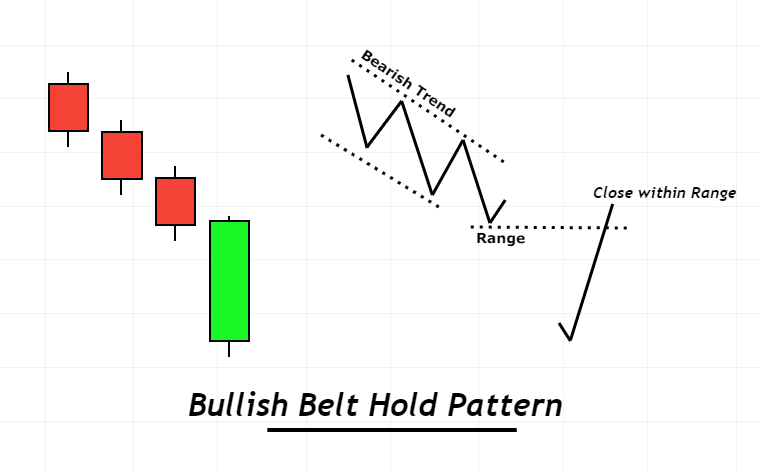
The three bearish candlesticks on the chart indicate a continuous bearish trend of the market. Then the opening of a new candlestick with a gap down the low of the previous candlestick means sellers have utilized their full potential. Because the market was already in an oversold position but a bearish gap has confirmed that sellers have used their full power. Now buyers will come into the market.
A big bullish candlestick engulfing the gap and closing within the range of the previous candlestick represents that now buyers are controlling the market and they have overcome the forces of sellers by clearing the barrier created by sellers. It indicates that a new bullish trend will start.
This is the reason that why should you use a bullish belt hold candlestick pattern to identify a bearish trend reversal.
How to trade bullish belt hold pattern?
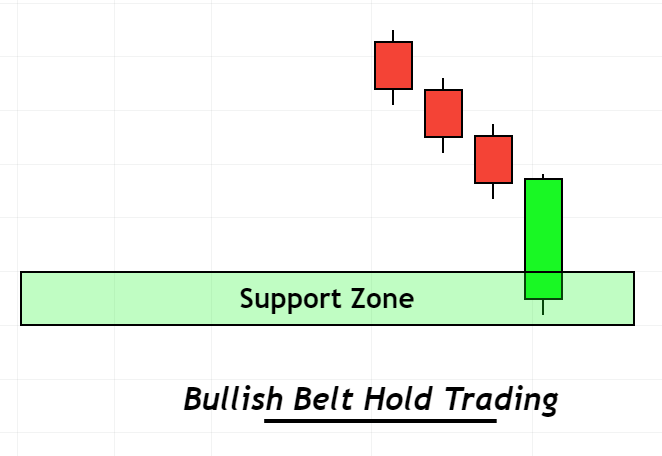
It is always recommended to trade candlestick patterns with other technical analysis tools for best results. Here I will explain the Bullish belt hold trading strategy. This strategy is a combination of two confluences.
- Support zone
- Bullish belt hold pattern

Find High Probability Trades with this ADVANCED Candlestick Patterns Course
The Ultimate Candlestick Patterns Course That Will Help You To Trade Better
Open a buy trade
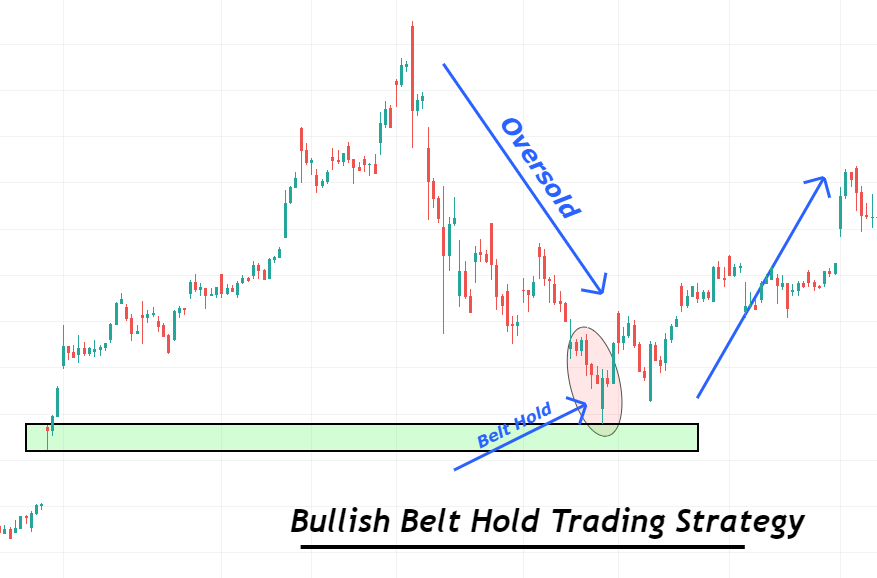
Identify a strong support zone on the price chart. There is a strong probability of trend reversal from the support zone. That’s why you should look for a bullish belt hold candlestick pattern at the support zone to increase the probability of trend reversal.
After the formation of the candlestick pattern, open a buy order instantly.
Stop-loss Level
The safe stop-loss level is below the support zone. That’s why stop-loss of buy order should be placed a few pips below the support zone.
Take-profit Level
Close the 75% of total trade when an order will reach a 1:1 risk-reward ratio. Then hold the trade until 1:2 RR ratio.
Pro tip: To get higher risk-reward ratios, use bullish belt hold candlestick pattern with technical chart patterns.
Conclusion
Although belt hold is a simple chart pattern yet there are few chances of its occurrence in major currency pairs because of high volatility and few gaps on the chart. It is a high probability pattern for stocks and indices traders.
It is advised to new traders to not trade a candlestick pattern without the confluence of the technical indicators. Because a candlestick pattern will work in trend and it will not work in range.
Make sure to backtest this candlestick pattern properly to avoid trading false patterns.