
Introduction
The chart patterns that represent the bullish continuation of price trends in a specific currency pair are the bullish continuation patterns.
These patterns are few and are considered the most important. Because these patterns indicate that there are still chances of an increase in the price of a currency pair. The second important thing is that these patterns form during the bullish trend, and they also forecast the direction of the trend, which is a double confluence.
For example, when the trend is already bullish, a chart pattern also shows the bullish continuation. The forecast of both price patterns aligns with each other, and the probability of a bullish trend increases.
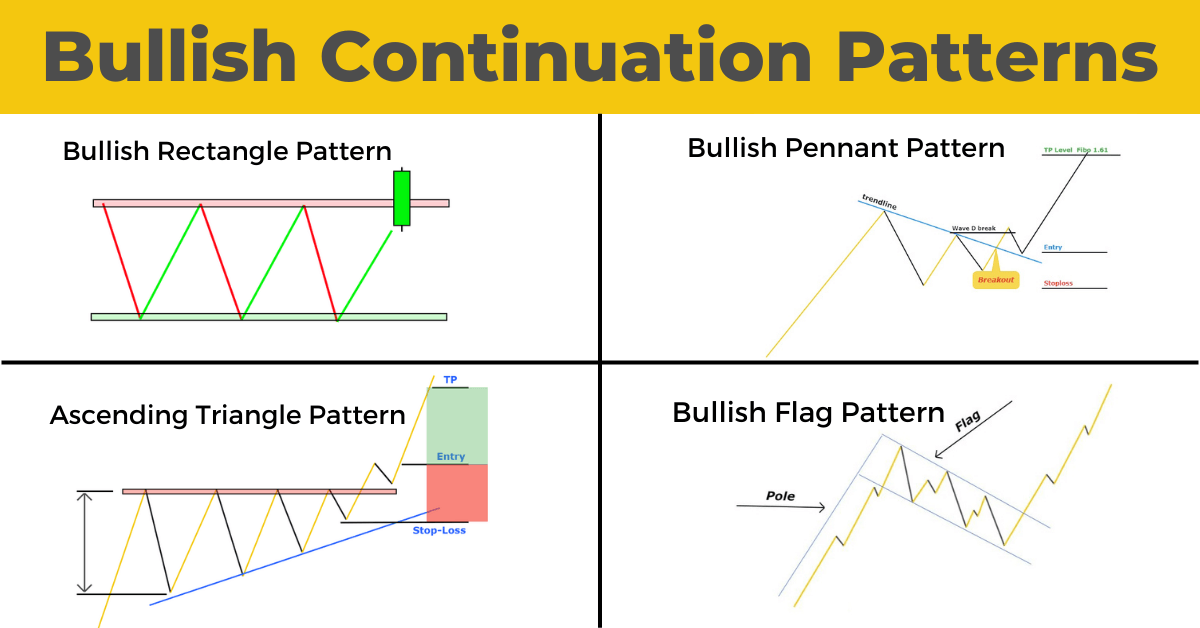
What are the best four bullish continuation patterns?
Four major chart patterns in the technical analysis show the continuation of the bullish trend.
- Bullish pennant pattern
- Ascending triangle pattern
- Bullish Flag pattern
- Bullish rectangle pattern
These are the chart patterns that a trader must remember in technical analysis trading. A trader must always open a buy trade in case of bullish continuation chart patterns.
How to find bullish continuation chart patterns?
Here I have explained a brief introduction to each chart pattern so you can get an overview. However, if you want to get a detailed guide, you can also click on the learn more button at the end of each pattern.
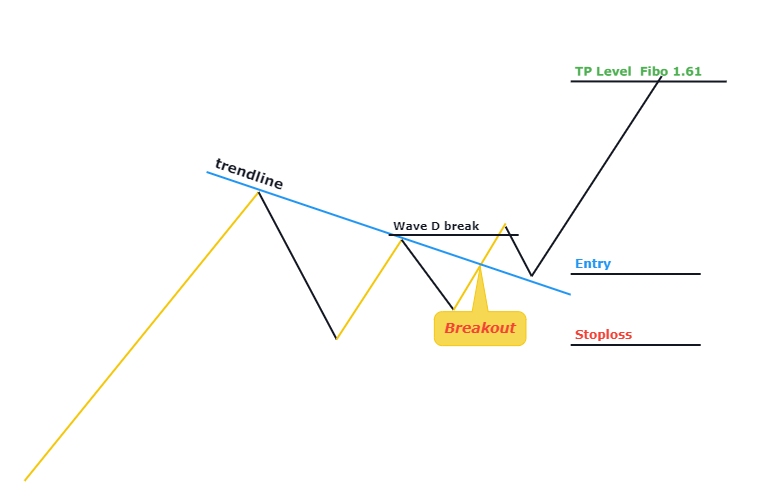
Bullish Pennant pattern
The bullish pennant pattern combines a big bullish impulsive wave and minor price retracement.
The impulsive price wave represents the Pole, and the small retracement after the impulsive wave indicates a flag. So it is a flag and pole pattern.
In the first phase, you’ll have to identify a bullish impulsive wave. It means when there must be a strong bullish trend. A retracement wave will form in the second phase after the impulsive wave. Please keep in mind that this retracement will be more minor in size.
Each successive wave during this retracement will be smaller than the previous wave. After three to four smaller waves, another bullish trend will start. This shows the continuation of the bullish trend.
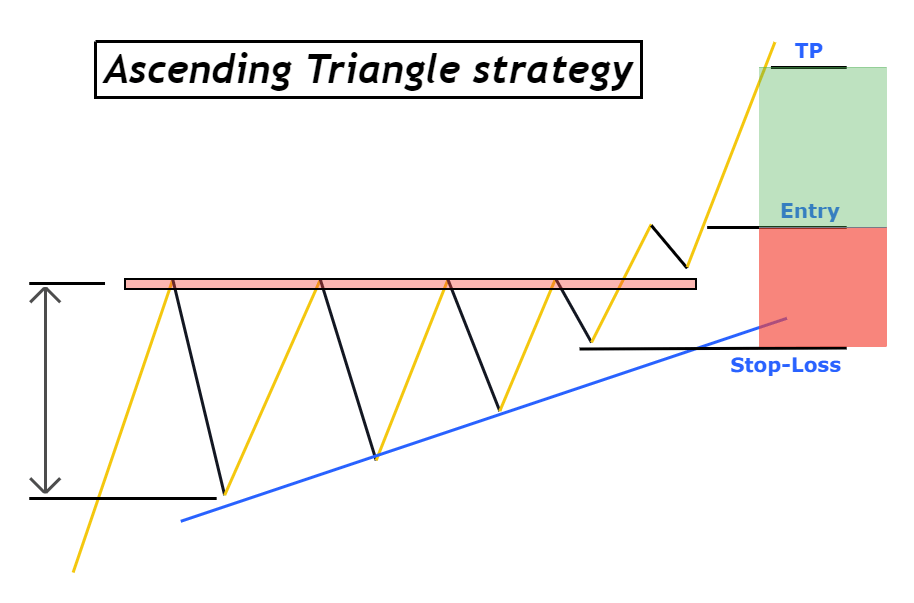
Ascending triangle pattern
Ascending triangle chart pattern consists of a combination of a resistance zone and price waves bouncing from the resistance zone.
In this pattern, the price bounces from the resistance zone. After the first and most significant price bounce, each successive price bounce from the resistance zone will be smaller than the previous price bounce. But the base/resistance zone will remain the same. This phenomenon will adopt the shape of a triangle. That’s why it’s called ascending triangle pattern.
After at least three waves, the price will break the resistance zone, and a new bullish trend will start.
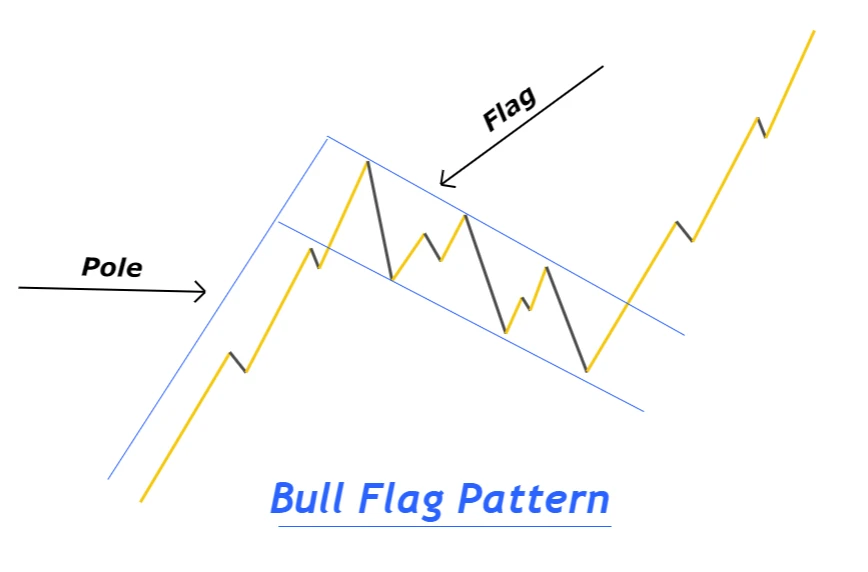
Bullish flag pattern
It is a flag and pole pattern like the pennant pattern. But in the flag pattern, the size of the flag will be bigger, and a significant retracement wave will form.
First, a bullish impulsive wave will form with the strong momentum of buyers. It will act as a pole of the flag. After pole formation, the price will start retracing downward to Fibonacci 50 or 60 level. The retracement will form like a downward price channel with an upper and lower boundary. Then after a break of this channel, the price will continue the bullish trend, and a strong bullish impulsive wave will form again.
The bullish flag is the most widely used chart pattern in trading and has a very high-risk reward and winning ratio.
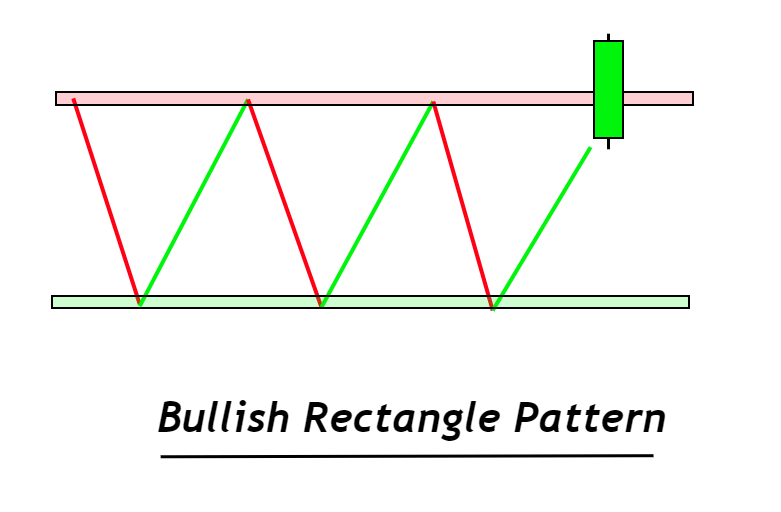
Bullish rectangle pattern
The bullish rectangle is a continuation chart pattern in which the price moves sideways on the chart, and after a resistance breakout, it will continue its bullish trend.
The rectangle pattern also acts as a reversal chart when it breaks the support zone. But here, you’ll only look for rectangle patterns that break the resistance zone to open a buy trade.
The price will move sideways in this chart pattern with no clear trend. It will make highs and lows with a resistance and support zone. Price will keep on moving within the support and resistance zones. A new bullish trend will start when the price breaks the resistance zone.
The bottom line
To make a profitable trading strategy, a trader should minimize the number of trading patterns. Because trading a single pattern profitably is better than trading 20 chart patterns in the loss.
So you should have to make your strategy according to your temperament.
I will highly recommend you read each chart pattern in detail to get the maximum knowledge