

Definition
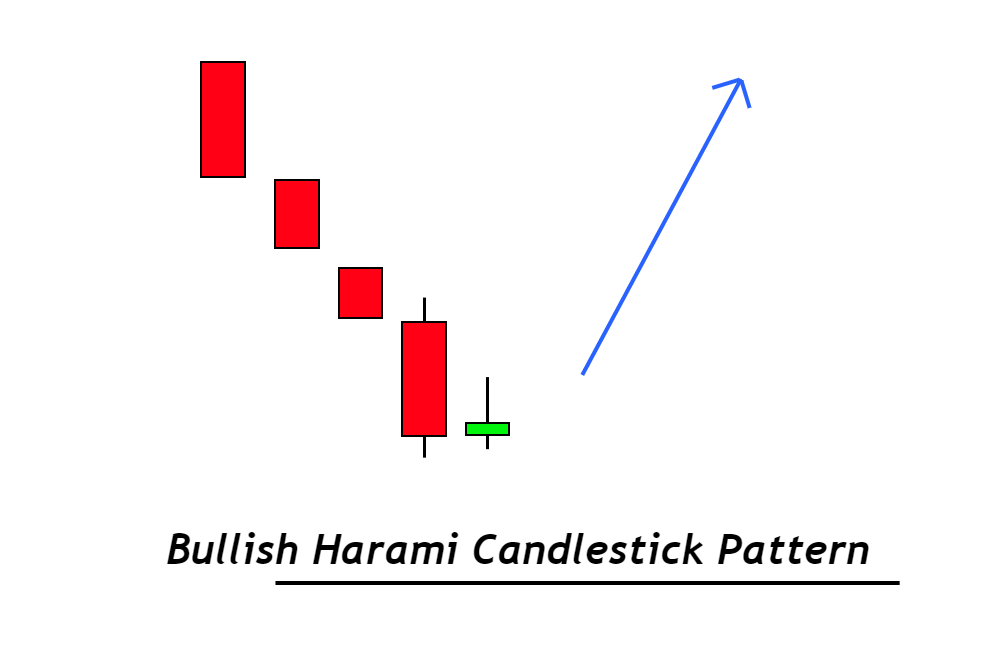
Bullish harami is a trend reversal candlestick pattern that consists of a big bearish candlestick with a small candlestick. The small candlestick form within the range of the previous bearish candlestick.
The Harami pattern is also known as the inside bar pattern. Retail traders most widely use it because it is a decisive candlestick. It determines the change of a bearish trend into a bullish trend. A bullish harami pattern has a high winning ratio on a higher timeframe.
In this article, I will explain a complete guide to bullish harami pattern with a trading strategy. The best thing about this pattern is that it gives a very high risk-reward ratio due to tight stop loss.
How to identify a bullish harami pattern?
Finding accurate candlestick patterns is most important. Because if you find wrong patterns on the price chart, it will lead to a loss in trading, and you’ll suffer many psychological factors. That’s why I have explained the structure of bullish harami in the steps that are following:
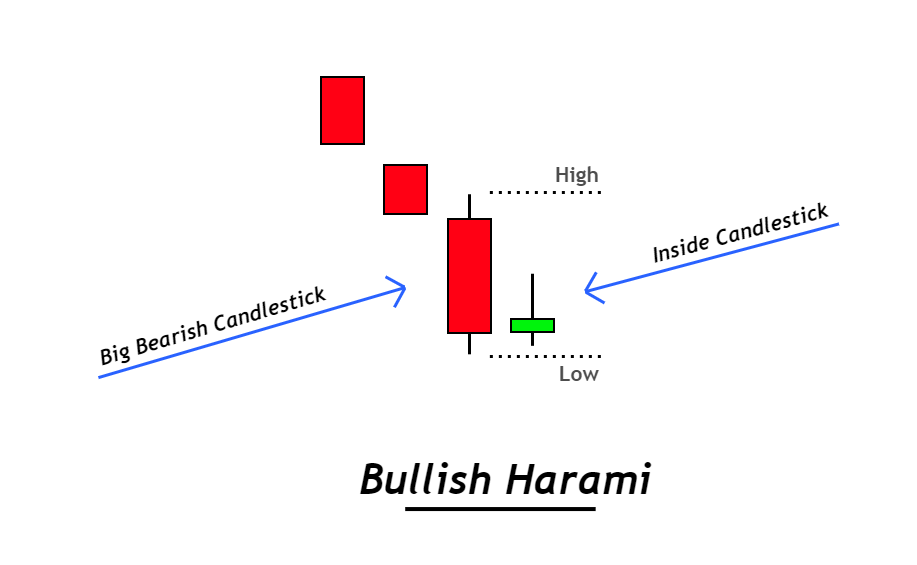
- The first candlestick will be a big bearish candlestick. The body-to-wick ratio should be more than 60%. It means it will have small wicks/shadows with a large body.
- A small candlestick should form within the range of the previous candlestick. It means the price will form a higher low and lower high trend.
- The color of a small candlestick can be green or red. It does not matter because the pattern’s structure is the most important.
After finding a high probability bullish harami candlestick pattern, the next step is the addition of confluences.
Two confluences will increase the winning probability of a bullish harami candlestick pattern.
- Location of candlestick
- Breakout of inside candlestick

Find High Probability Trades with this ADVANCED Candlestick Patterns Course
The Ultimate Candlestick Patterns Course That Will Help You To Trade Better
Location of harami candlestick pattern
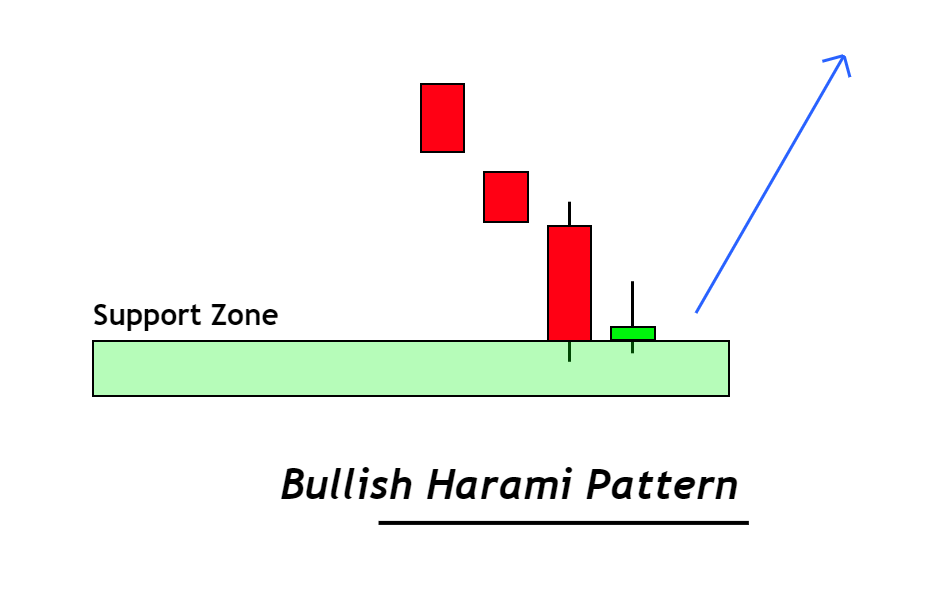
The most critical parameter is the location of the candlestick on the price chart. Because mostly trend reversal candlestick patterns don’t work in ranging or choppy market conditions. I always recommend adding a location filter to the trading strategy.
- The bullish harami pattern should form at the end of the downtrend. It means the prior trend before forming this pattern should be bearish.
- It should form during price oversold conditions.
If you’re a beginner or intermediate trader, you can check the oversold conditions using the RSI indicator. However, the recommended method is to check using price action.
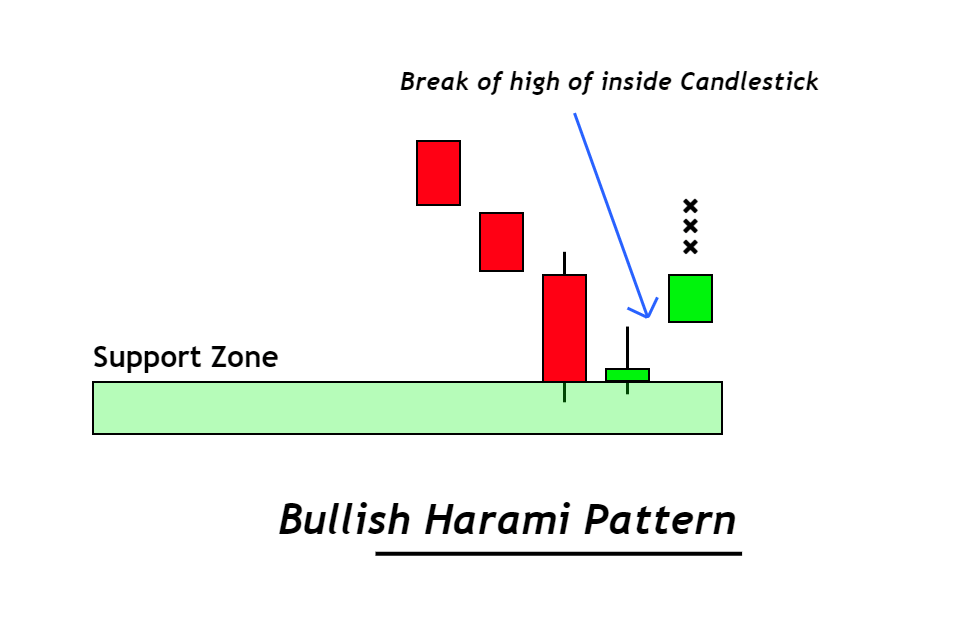
Breakout of harami pattern
After forming the harami candlestick pattern, the next price will break the inside candlestick. This breakout confirms the future trend of the market.
As it is a bullish trend reversal pattern, the inside candlestick must only break in the bullish direction. It will not be a valid pattern if it breaks in a bearish direction.
What does the bullish harami pattern tell traders?
An advanced technical trader can determine the activity of traders behind the candlestick chart by just looking at the price action. This ability will come with screen time only. It helps traders in determining the market conditions and in making accurate decisions.
Let’s understand the activity of traders behind the formation of the bullish harami pattern.
As I specified, the prior trend before the harami pattern will be bearish. It shows that sellers are dominant in the market, and the price is decreasing. Buyers are not strong enough to push up the price. So sellers start becoming weak when the price reaches a certain key support level and is in an oversold zone. Because they have used their full power, they are now becoming weak while buyers are becoming strong.
So at a specific key support level, when buyers are strong enough to push up the market, market makers make a big bearish move in the form of a big bearish candlestick to capture retail traders. Then a small candlestick inside the range of the previous candle formed. It shows that market makers are deciding either to continue the bearish trend or take a trend reversal. After this decision phase, the price will break the inside candlestick in a bullish direction, confirming the bullish trend reversal in the market.
When these two bullish trend reversal confluences meet up, the probability of trend reversal increases. And we will benefit from this price chart analysis by trading with market makers in the bullish direction.
This is how it works.
How to trade bullish harami patterns on Intraday timeframes?
The bullish harami candlestick trading strategy consists of four confluences:
- Daily timeframe trend: The daily or higher timeframe trend should be bullish. This is a simple method to trade with the trend.
- Key support level: The bullish harami should form at a support zone. It also helps in adjusting a safe stop loss level.
- Breakout: the inside candlestick should break in the bullish direction.
- Oversold conditions: the price should be in the oversold region or below the 45 RSI level. You can also use price action to determine oversold conditions.
When these four confluences meet, then a high probability trading signal forms.
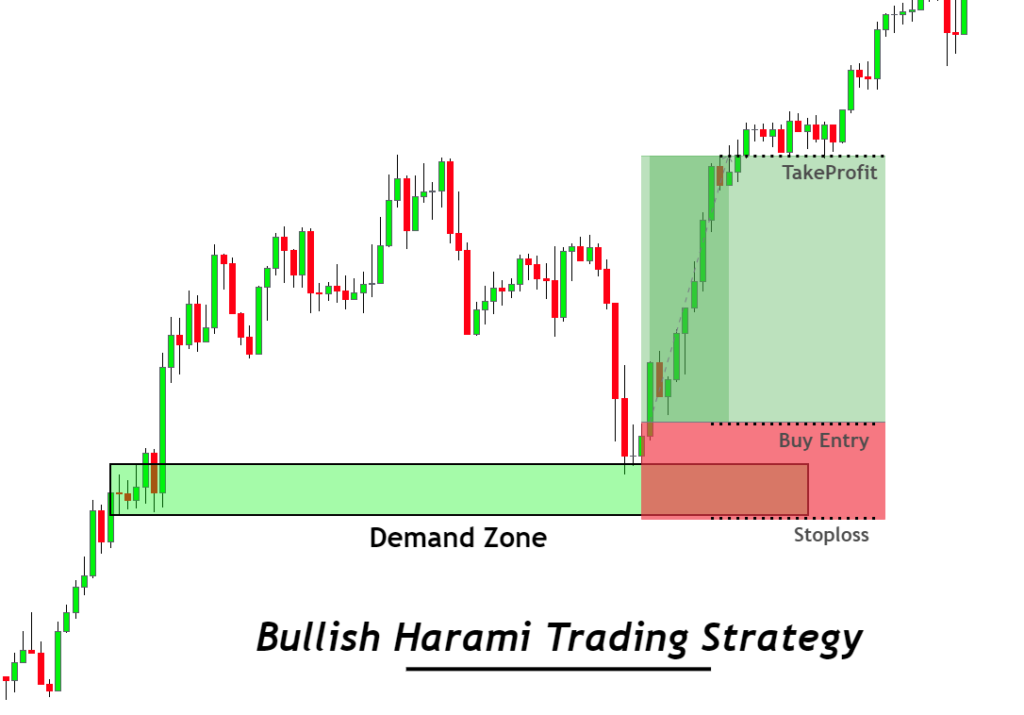
Open a buy trade
When the above confluences meet, open a buy trade just after the breakout of the inside candlestick. And place stop loss below the support zone.
Take profit level is determined by drawing Fibonacci on the last bearish wave. However, it would be best to try holding the trade using a higher timeframe analysis.
The Bottom line
The Harami pattern is a candlestick pattern that every trader should use in technical analysis trading. It is also my favourite pattern, and I use it to identify trend reversals in the market.
You should also learn the inside bar pattern to learn more in detail.