
Definition
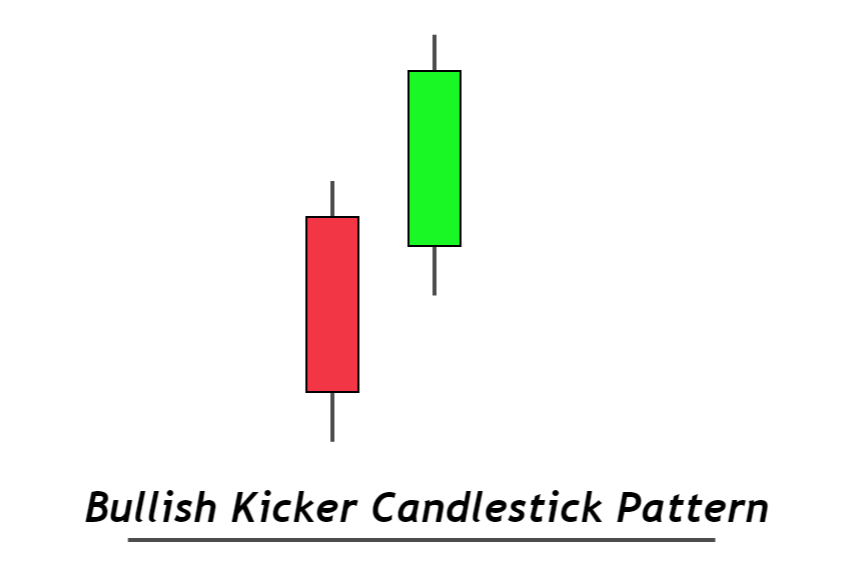
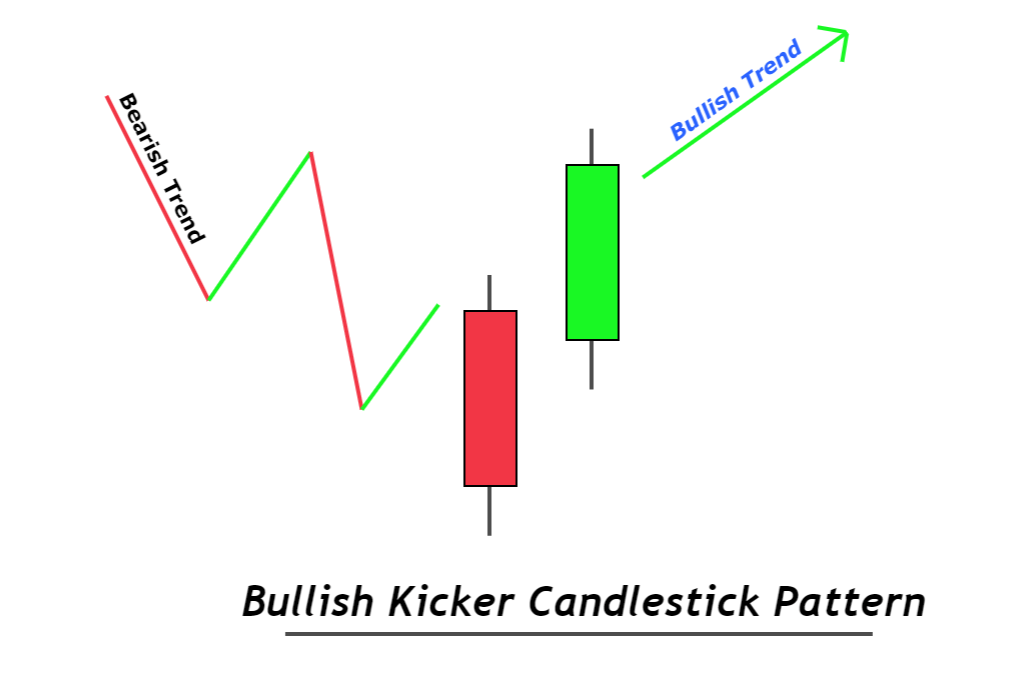
Bullish kicker candlestick is a bullish trend reversal candlestick pattern consisting of two opposite-colored candlesticks with a gap between them. It will turn the bearish trend into a bullish price trend.
To remember this pattern, let’s take an example. For example, when a player kicks a falling football before the football hits the ground. In the same way, after a few bearish candlesticks, a big bullish candlestick will suddenly form with a gap up. That’s why it is called a kicker pattern.
How to identify a kicker candlestick pattern?
To find out the kicker pattern on the price chart, follow the following guidelines
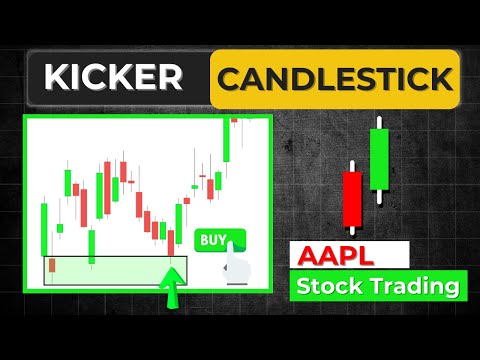
- Step 1: The first candlestick should be a big bearish candlestick. The prior candlesticks should also represent the downtrend on the price chart.
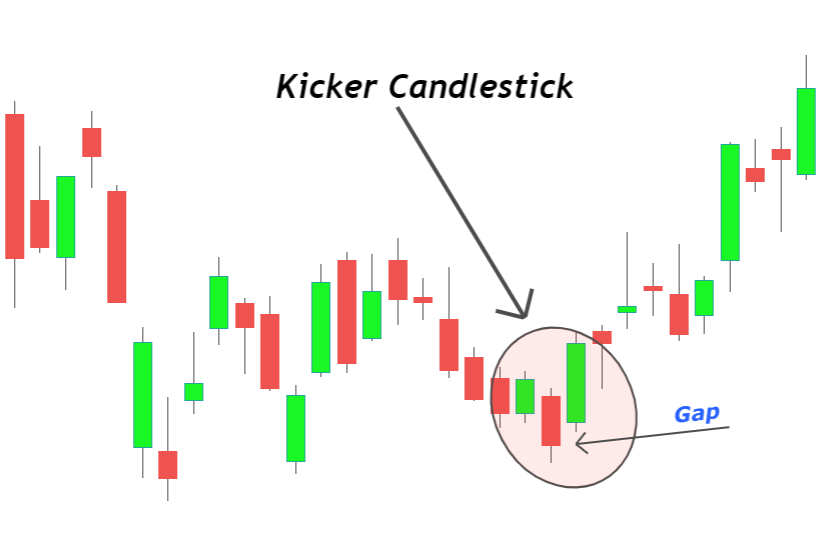
- Step 2: The second candlestick will open with a gap up above the high of the previous bearish candlestick. Then it will close above the opening price.
These are two simple steps you need to remember for this pattern. It is a high probability candlestick pattern and has a high success rate. The addition of technical confluences can also increase the winning ratio.

Find High Probability Trades with this ADVANCED Candlestick Patterns Course
The Ultimate Candlestick Patterns Course That Will Help You To Trade Better
Best working conditions for the kicker candle pattern
It is always recommended to not rely on a single candlestick pattern in trading. Because the market is full of false patterns and the psychology of trading is another big hurdle on the way to success. That’s why you should always add other technical confluences.
Here are three significant confluences
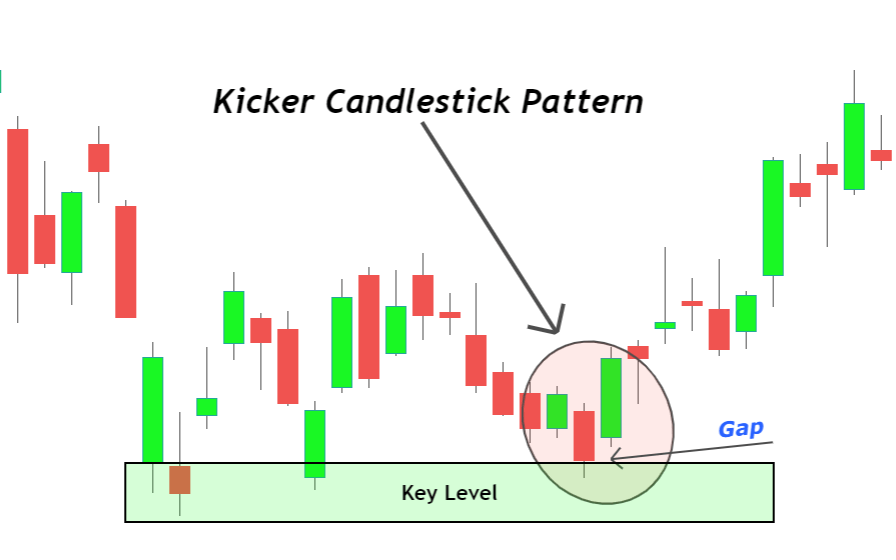
- Support or Demand zone: The demand zone is a price key level that causes a price increase. Price always bounces from these key levels. The kicker pattern already is a bullish trend reversal pattern. So, if we combine these two technical tools, the probability of bullish trend reversal will increase.
- Oversold Zone: When the price falls to the oversold zone, or the RSI value decreases below 30, it is evident that the price will rise again because the price travels in the form of waves on the price chart.
Confluences will help to filter trade setups. Because if a kicker pattern does not form at the key level or in the oversold region, you will not trade that setup. When a pattern creates at the key level, you will pick that setup because it is a high probability trade setup with a high winning ratio.
Kicker Candlestick: Information Table
| Features | Explanation |
|---|---|
| Number of Candlesticks | 2 |
| Prediction | Bullish trend reversal |
| Prior Trend | Bearish trend |
| Relevant Pattern | Bullish piercing pattern |
What does the kicker candlestick pattern tell traders?
The prior trend to the kicker pattern formation is bearish. It shows that sellers are in control and the price of an asset decreases with time.
After the bearish trend, a big bearish candlestick will form at the key level, showing the break of a level. During this price action, many retail traders will open sell orders. But after this bearish candlestick, due to a big event, a big bullish candlestick will form with a gap up, hitting the stop losses of retail traders.
Now a bullish price trend will start eliminating the sellers. Now buyers are in control, and they will keep increasing the price value.
The bottom line
It is recommended to add a confluence of support or demand zone with the kicker pattern while trading stocks or indices. This candlestick pattern will mostly form in the chart of stocks.
You should identify kicker patterns on the daily timeframe for best results.