
Definition
Bump and Run is a market pattern consisting of two phases determining the price trend reversal. It is a rare chart pattern, and traders use it in stocks, indices, and forex trading.
Thomas Bulkowski invented the Bump and Run pattern. He examined the market structure and made a chart pattern using price action. Retail traders widely use it to forecast the long-term trend analysis of the market.
At the end of this article, I’ll explain a simple trading strategy to trade this chart pattern effectively.
How to identify Bump and Run Pattern?
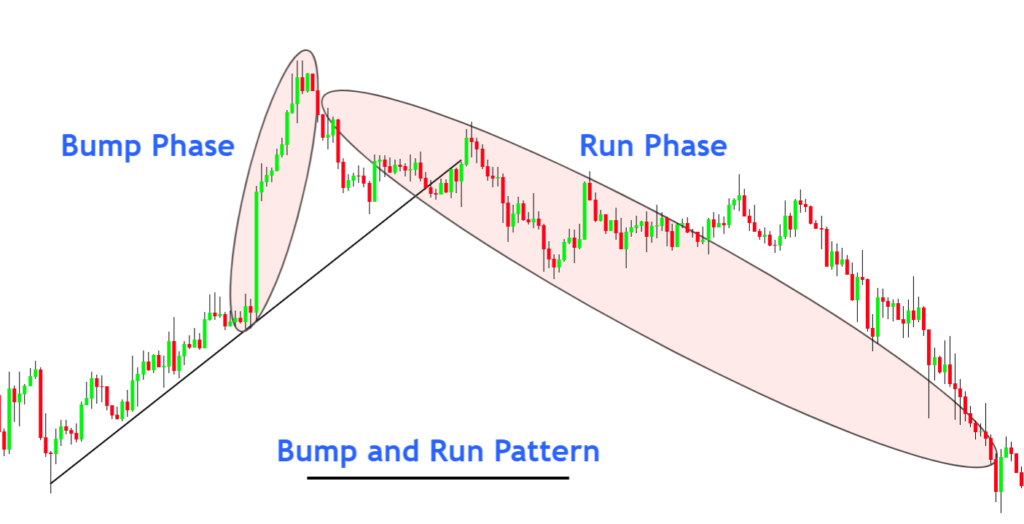
To find this chart pattern you should understand the two phases of the market
- Bump Phase
- Run Phase
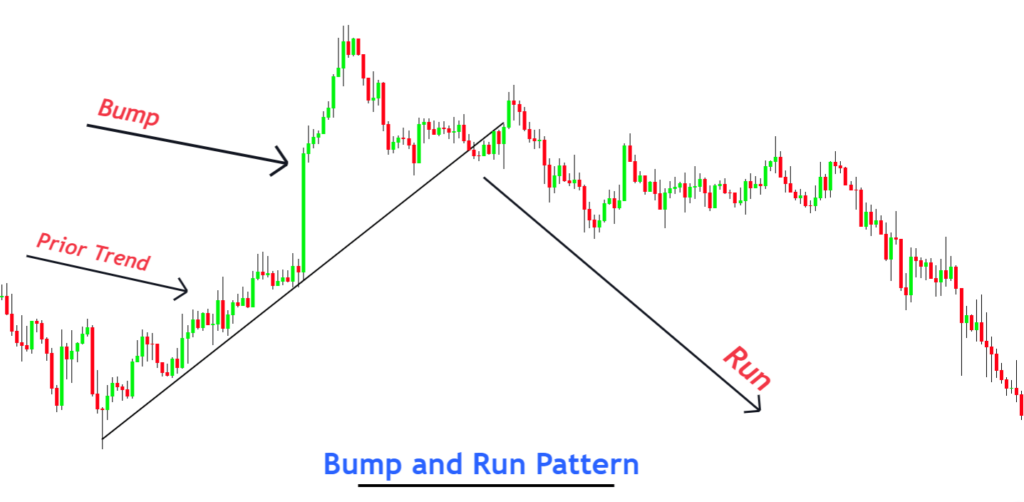
Bump phase
The bump phase price will make a bullish or bearish trend depending on the primary trend. A sudden bump in the price pattern will come
A bump is simply an impulsive wave at the end of the trend.
Before Bump, there was always a trend either bullish or bearish. After the trend, a Bump will form.
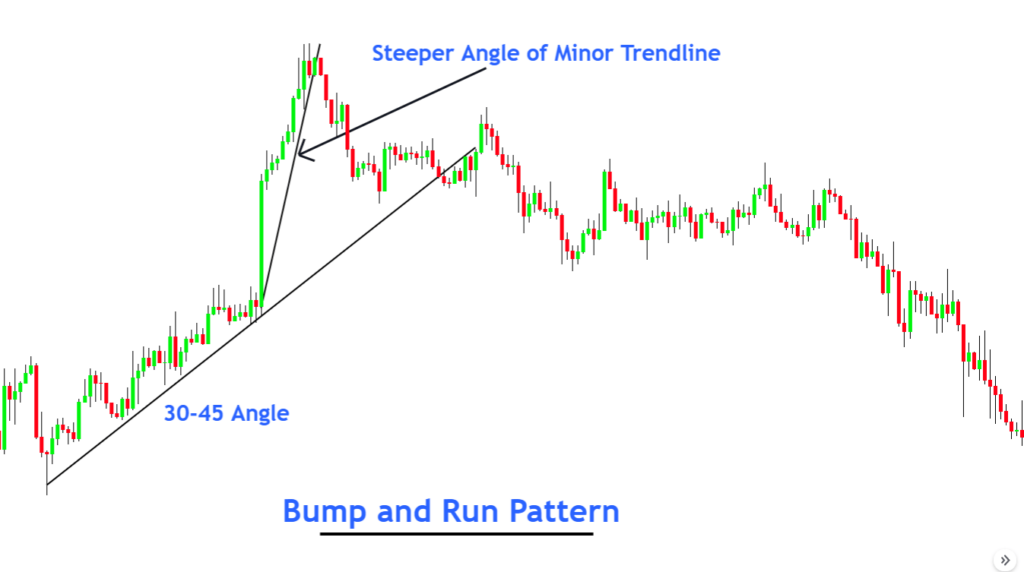
How to identify Bump on the chart?
The first step is to draw a trend line based on the previous trend (higher highs and higher lows). According to Bulkowski, the trendline should have a 30-to-45-degree angle based on the logarithm scale on the price chart. This angle shows the strength of the trend.
Tip: Small-angle represents weak price trend while large-angle represents strong price trend.
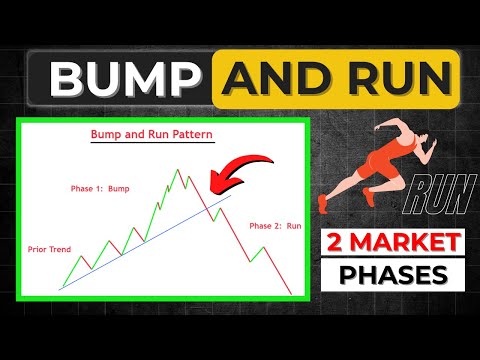
There must be two to three waves before the Bump to identify a valid pattern on the chart. Look at the image below for a better understanding.
After drawing a trendline on the previous slow trend, you should look for the upcoming Bump in price. During the Bump, the price will move with a steeper trend, moving away from the trendline. Like a false price movement. You can also draw a minor trendline on the bump to confirm the trendline breakout.
The bump wave should be greater in size than the previous two to three waves.
How to identify Run on the chart?
After the formation of the Bump, the Run is the second phase of this pattern. Price will break the minor trendline of Bump, and then the Run phase will start. A major trend reversal happens in the market, and the price will move in the opposite direction in an impulsive wave. Then it will also break the major trendline, and another impulsive wave will also form.
Types of Bump Pattern
This chart pattern is further categorized into two types based on the direction of a trend reversal
- Bullish Bump & Run
- Bearish Bump & Run
Bullish Bump & Run
It represents the bullish trend reversal. The Bump will show a bearish price trend. After the trend line breakout, a bullish trend reversal will happen. The Run phase will be in the bullish direction.
Bearish Bump & Run
It indicates the bearish price trend reversal. In this type, the Bump will show a prior bullish trend. After the trendline breakout, a bearish trend reversal will happen. The Run phase will be in the bearish direction.
What do the Bump and Run pattern tell traders?
This chart pattern shows the activity of traders behind the candlestick chart. If you read the price, you will be able to understand it.
Let’s assume the prior trend to the Bump formation is bullish. Price is forming bullish waves. It means buyers are stronger than sellers. When a Bump forms, it shows that price has moved larger numbers within a short time interval. Retail traders are not able to move the market like this. So, the Bump move is caused by big traders and institutions.
It shows that big traders have a price level in their mind that they want to break before a trend reversal. The straightforward rule is that big traders eliminate the retail traders before a trend reversal.
In this case, Bump is the way big traders eliminate retail traders, and then a big trend reversal happens.
Tip: Price will break a significant key level before moving in the opposite direction.
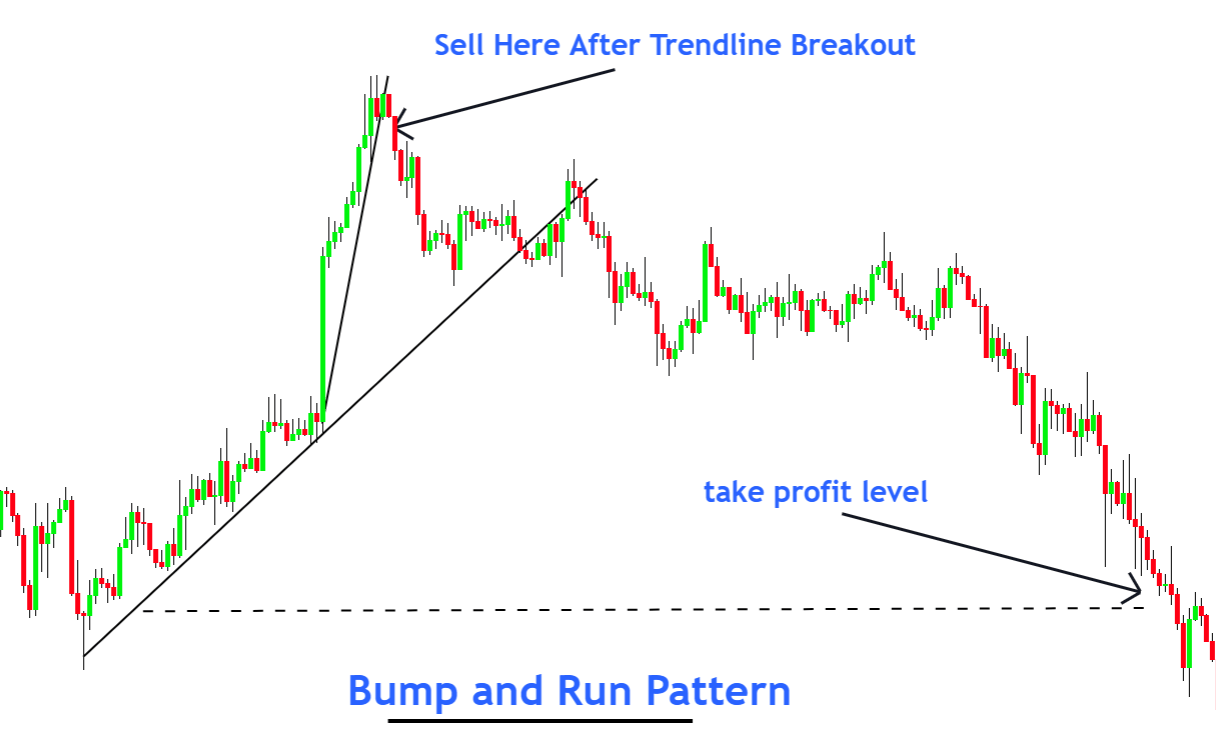
How to trade Bump and Run chart pattern?
To trade this pattern, there are two simple ways.
- You should open an order in the first method just after a minor trendline breakout.
- In the second method, you should open an order after the breakout of the major trendline breakout.
The second method offers a meager risk-reward ratio, so I recommend you opt for the second method. It is risky, but it will also provide a high risk-reward.

The Bottom Line
Price reading is the priority for a price action trader, and the Bump Run pattern is the perfect example. It is a high probability trade setup.
Some traders add confluence of volume with the Bump wave, but I will recommend you skip volume in the case of forex. Because in forex, tick volume is used.
It would be best if you backtested this pattern properly before using it on a live account.
Hi Ali,
Good read on your website. Looking to join your service. I am rookie trader and looking to grab more knowledge. What is your background on trading?
Wasalam