

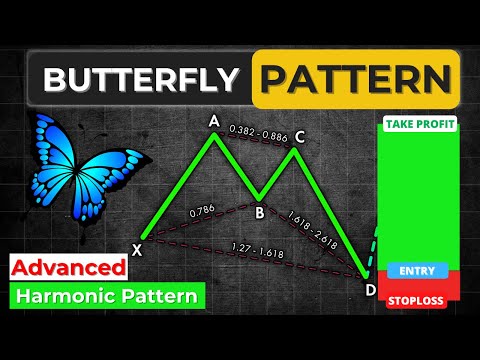
Butterfly pattern consists of 4 waves, and it is a reversal chart pattern in forex trading. To detect a butterfly pattern, specific Fibonacci retracement and extension levels are used This pattern is found in nature which is why it is being used in forex technical analysis.
To increase the probability of this pattern, specific Fibonacci levels are used. There are two types of a butterfly pattern.
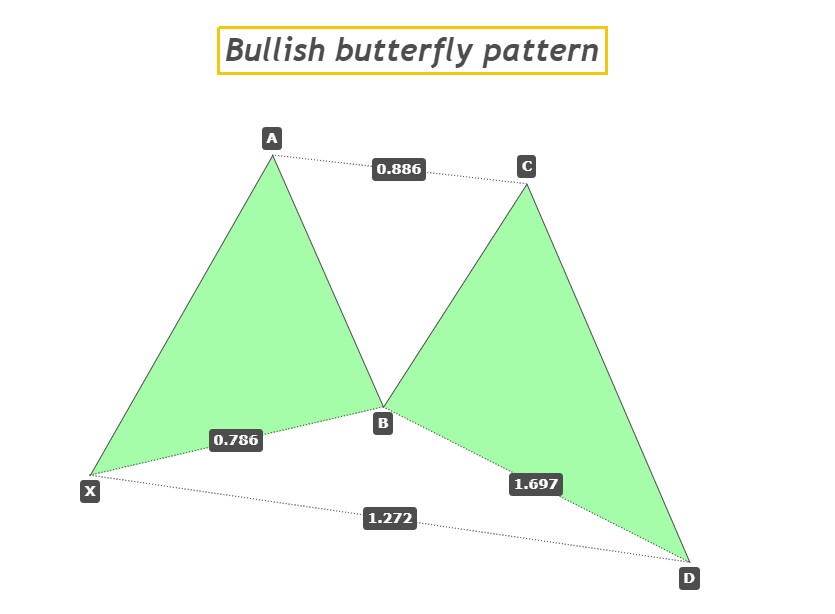
- Bullish butterfly pattern
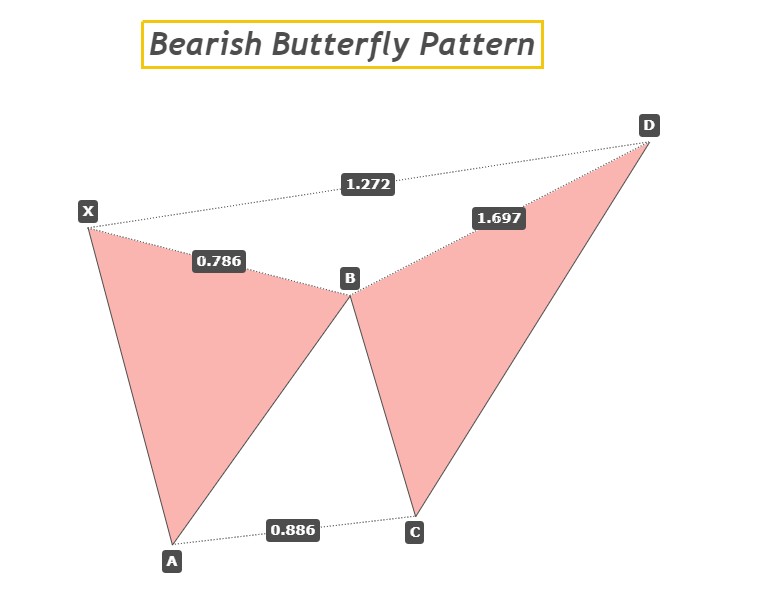
- Bearish butterfly pattern
Butterfly harmonic pattern rules
It consists of four waves XA, AB, BC, and CD. Follow few simple steps to identify butterfly pattern in forex.
- Wave XA must be an impulsive wave.
- Wave AB must retrace to 0.618 – 0.78 level of XA.
- BC wave must retrace to 0.38 -0.88 Fibonacci level of AB.
- For CD wave, there are two options either CD wave can be equal to AB or must retrace to 1.272 extension level of wave XA.
These are four simple steps to find a good butterfly chart pattern. There are many techniques that can be used using Fibonacci to get maximum output and a good chart pattern.
Bullish butterfly
in a bullish butterfly pattern, the wave XA will be a bullish wave. wave AB and CD are retracement waves. The final resultant wave will also be a bullish wave. the bullish butterfly pattern is an indication of turning a bearish trend into a bullish trend.
Bearish butterfly
In a bearish chart pattern, wave XA will be a bearish wave. The resultant wave will be bearish and the bearish chart pattern will convert the previous bullish trend into a bearish trend.
Psychology of butterfly pattern
The psychology behind this chart pattern is very simple. Wave XA shows the start of a new trend to capture retail traders but then the price will retrace. Most retail traders will try to place trades at 0.618 or 0.78 Fibonacci levels but after a minor fake-out (BC wave) to capture more retail traders, a final CD wave will come to hunt stop loss. After stop loss hunting, market makers will continue their move and an impulsive wave will form.
Fibonacci tool in butterfly chart pattern
Fibonacci retracement tool tells us a lot of things about the price. a retracement is inversely proportional to the power in trend.
- Deeper retracement means a less powerful trend.
- Less deep retracement means the more powerful trend
Use this tool in a butterfly pattern. For example, if wave A – D retraces to 1.272 Fibonacci extension level of XA wave then there are many chances that it will hit 1.618 extension level of wave AD.
If wave A – D retraces to 1.618 extension level of XA wave, then there are less chances that price will reach 1.618 extension level of wave AD, but it will hardly reach 1.272 level.
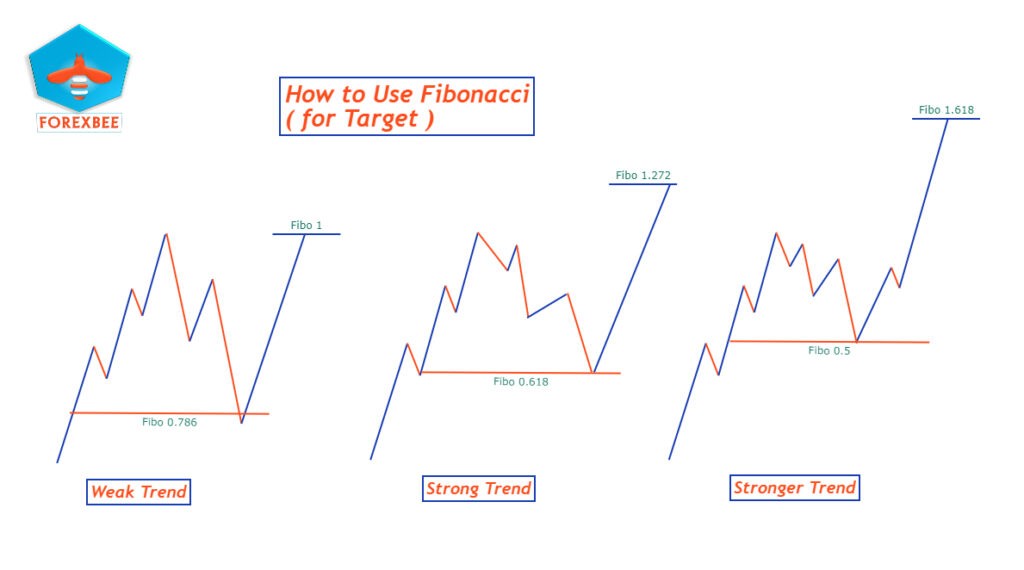
This is a way of reading price action.
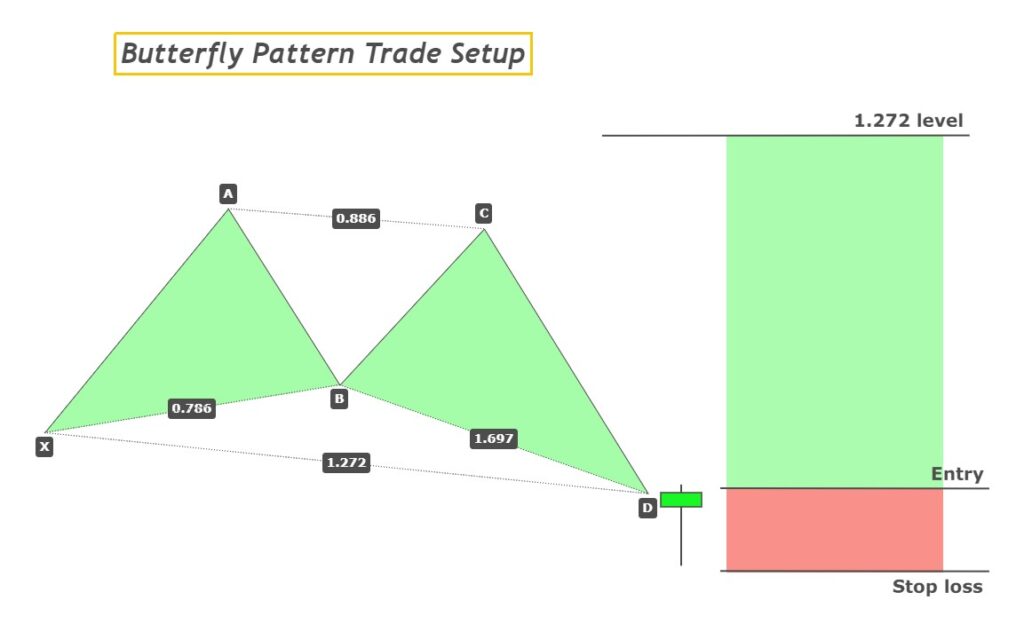
Butterfly chart pattern strategy
After identification of chart pattern, the next three important steps are to find out entry, take profit, and a safe stop loss level.
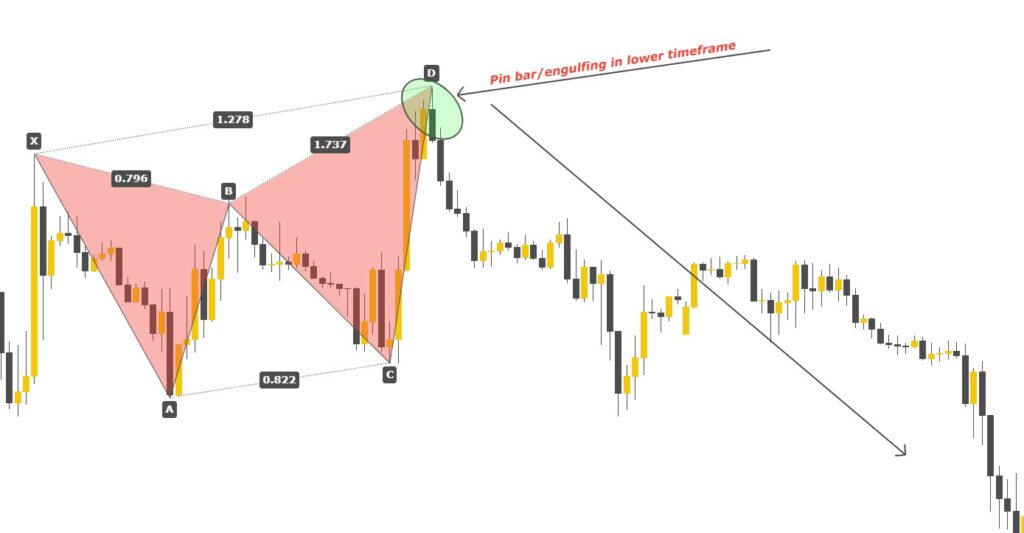
Candlestick patterns help a lot to get entry and stop-loss levels. So, we will add a confluence of the pin bar or engulfing pattern as a confluence to our trade setup.
Entry level
When the CD wave will retrace to 1.272 Fibonacci level then the next step is to look for a candlestick pattern (only look for a pin bar or engulfing candle by switching timeframes). If a pin bar pattern forms at 1.272 Fibonacci extension level, then place a trade instantly.
Stop loss level
There are two options for placement of stop loss.
- Place stop loss just below/above the candlestick pattern.
- Place stop loss below the 1.618 Fibonacci extension level.
Choose the safest option only. It depends on the situation because you must maintain a good risk reward ratio too.
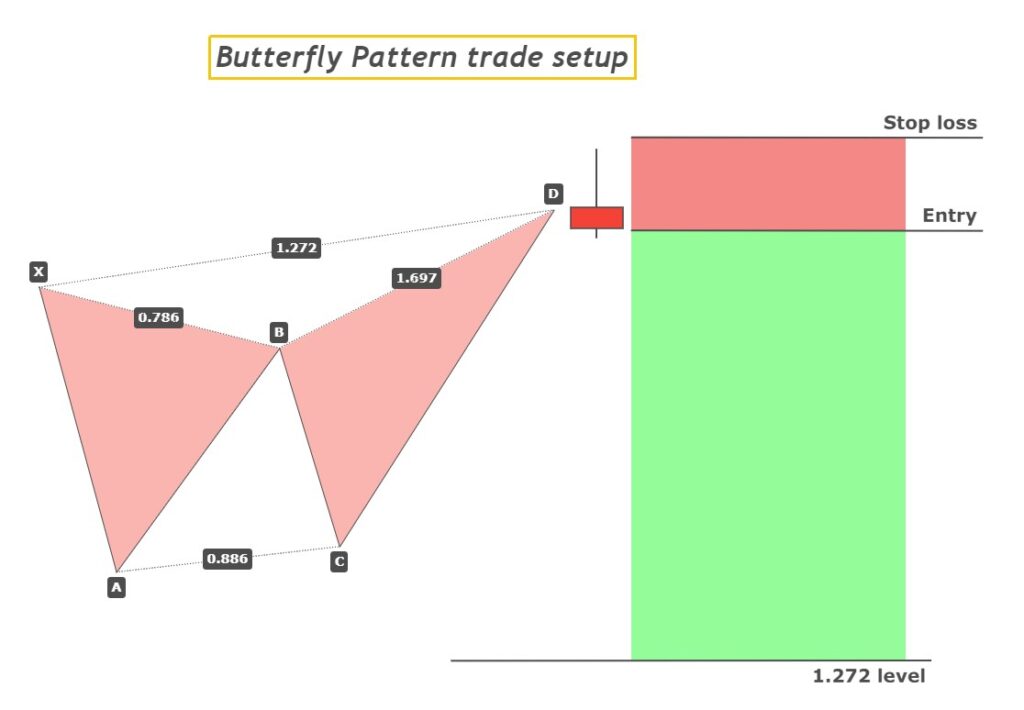
Take profit level
1.272 Fibonacci extension level of wave A to D will be a take profit level. Trailing stop loss, breakeven, and many other parameters are also used to get a higher winning ratio. Make sure to back-test properly before trading on a real account.
Make your own rules to make it a high probability setup like adding a confluence of higher timeframe trend.
Money is just something you need in case you do not die tomorrow.
Yvan Byeajee
I hope you will like this Article. For any Questions Comment below, also share by below links. Tradingview is the best chart tool
Note: All the viewpoints here are according to the rules of technical analysis and for educational purposes only. we are not responsible for any type of loss in forex trading.