
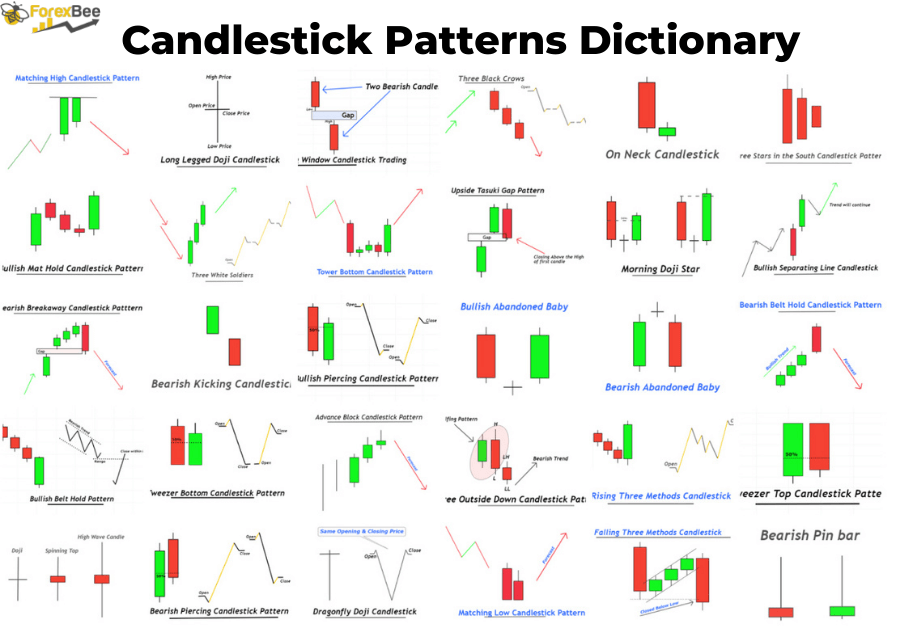
Introduction
In the candlestick patterns dictionary, 37 candlestick patterns have been discussed in each post. These patterns have a high winning ratio because we have added proper confluences to each candle to increase the probability of winning in trading.
Here in this post, you will get a short explanation of each candlestick.
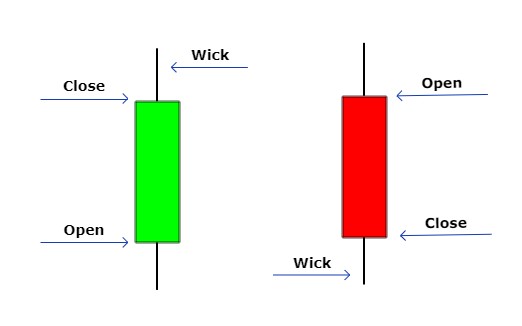
What are candlesticks?
A candlestick consists of three main points: closing price, opening price, and wicks. Candlestick indicates the direction of price, either bullish or bearish, showing information about price action.
- Open price: opening price indicates the first traded price of a specific pair exchanged during that time
- Close price: closing price indicates the last traded price of a specific pair exchanged during that time.
- Wick: wick indicates the variation in price relative to a specific pair’s opening and closing price.
Types of candlestick patterns
Candlesticks patterns are categorized into two major types based on the direction of the trend.
- Bullish candlesticks patterns
- Bearish candlesticks patterns
These two patterns are further classified into trend reversal, trend continuation, and ranging market patterns.
List of top 37 candlestick patterns
Here is the list of all the 37 high probability candlestick patterns.
| Candlestick Name | Forecast | Image |
|---|---|---|
| Pin bar candlestick | Buy/Sell | 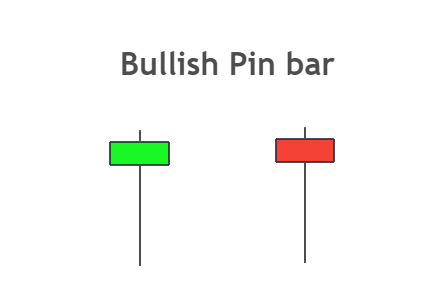 |
| Engulfing candlestick | Buy/Sell | 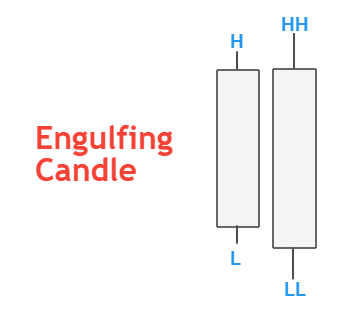 |
| Inside bar candlestick | Buy/Sell | 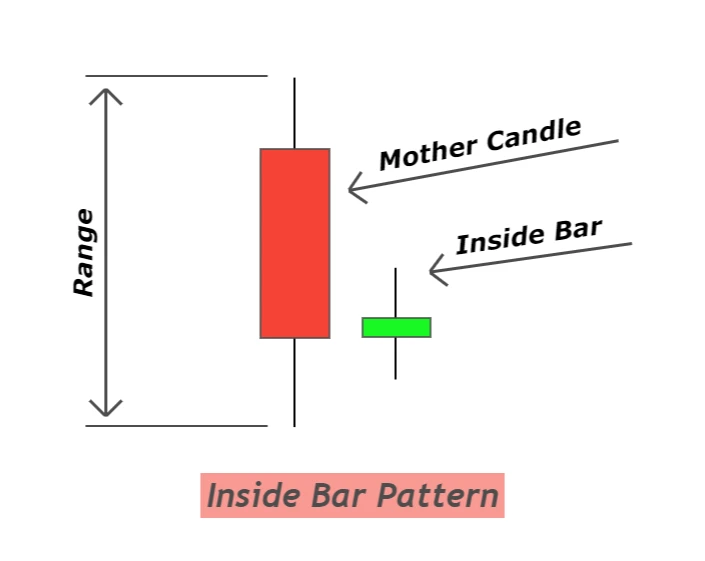 |
| Morning doji star | Buy | 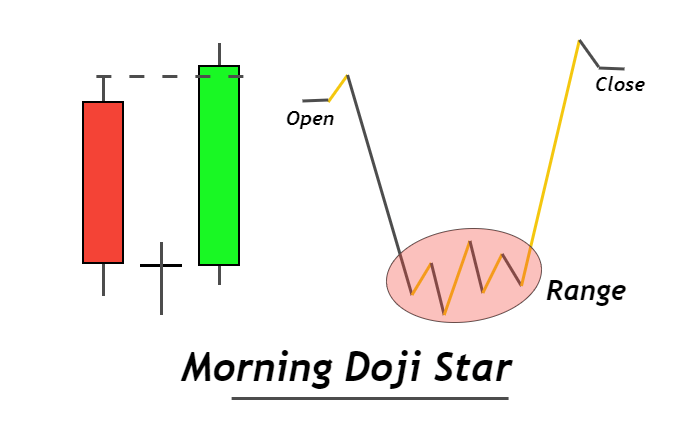 |
| Long legged doji | Buy/Sell | 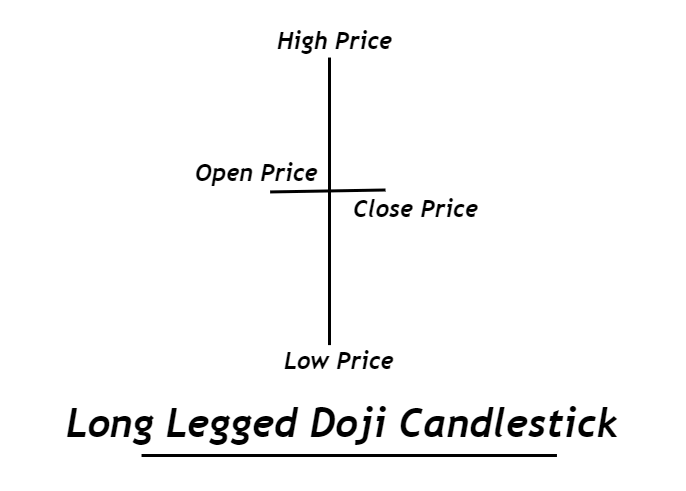 |
| Three outside down | Sell | 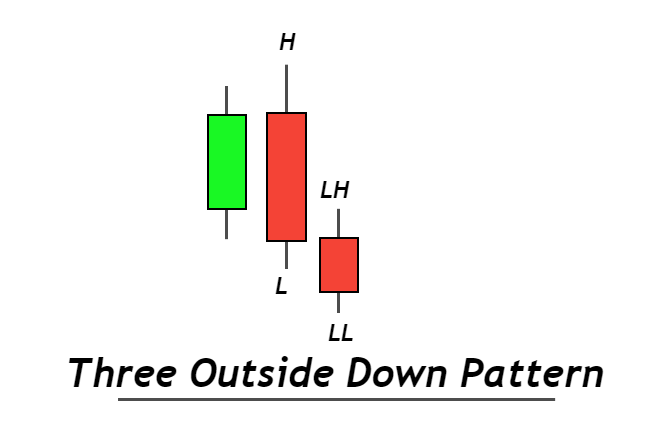 |
| Bullish belt hold | Buy | 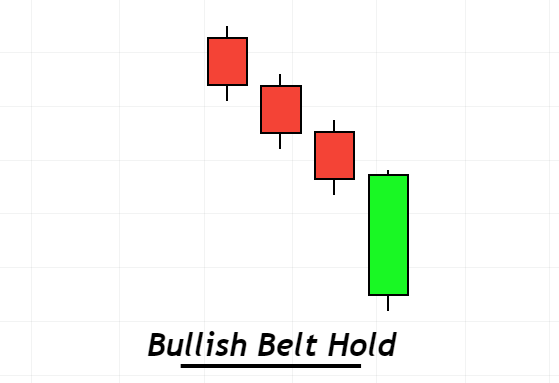 |
| Bullish piercing | Buy | 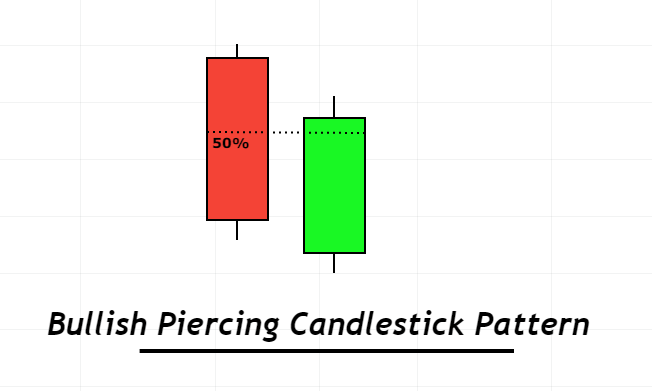 |
| Bearish belt hold | Sell | 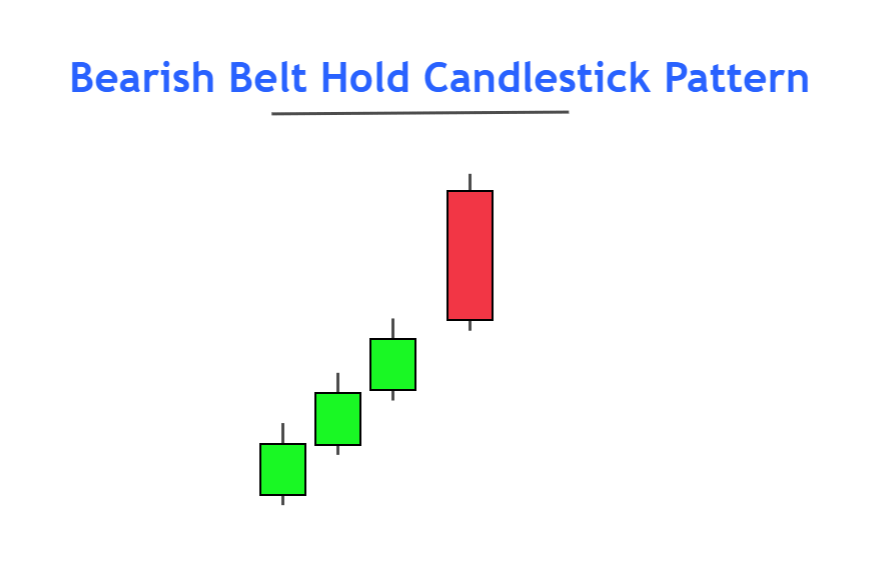 |
| Rising window | Buy | 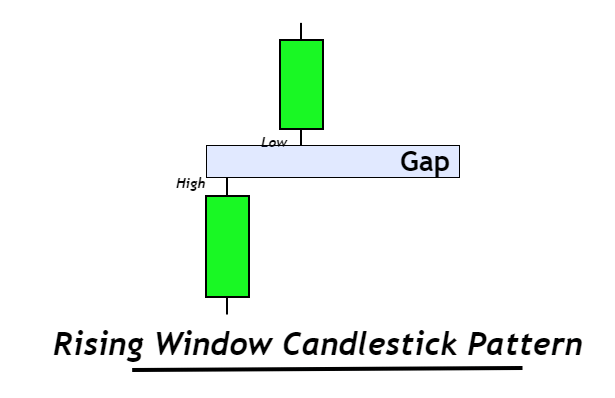 |
| Falling window | Sell | 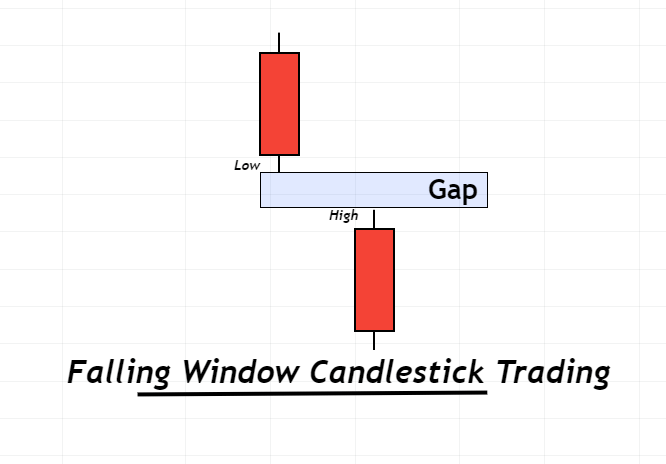 |
| Tweezer top | Sell | 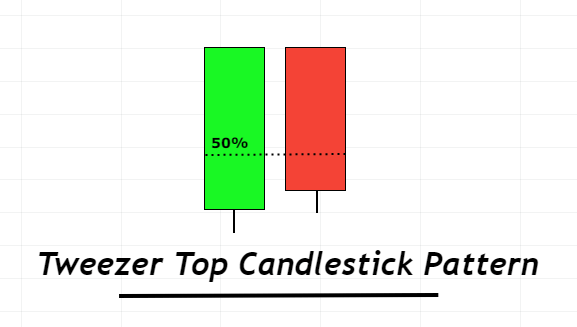 |
| Tweezer bottom | Buy | 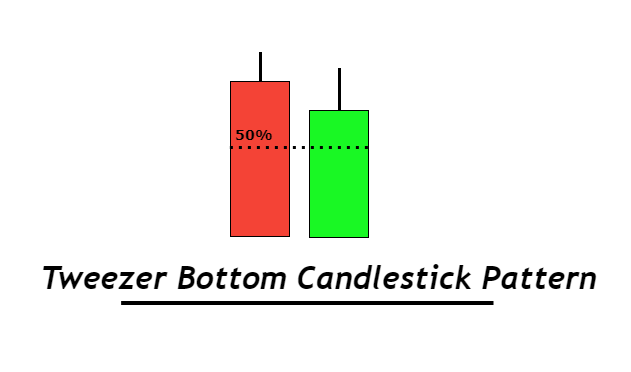 |
| Dragonfly doji | Buy | 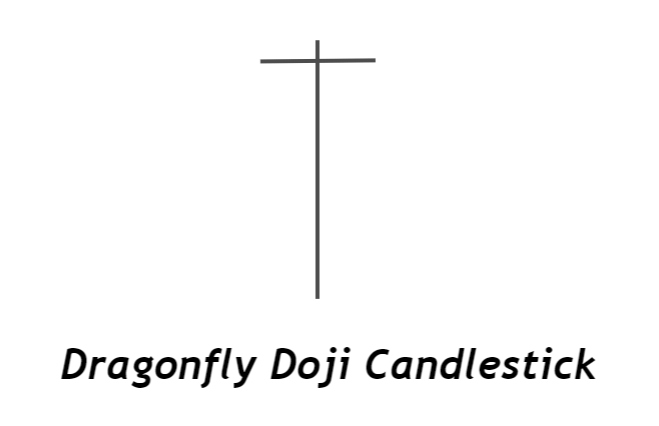 |
| Evening doji star | Sell | 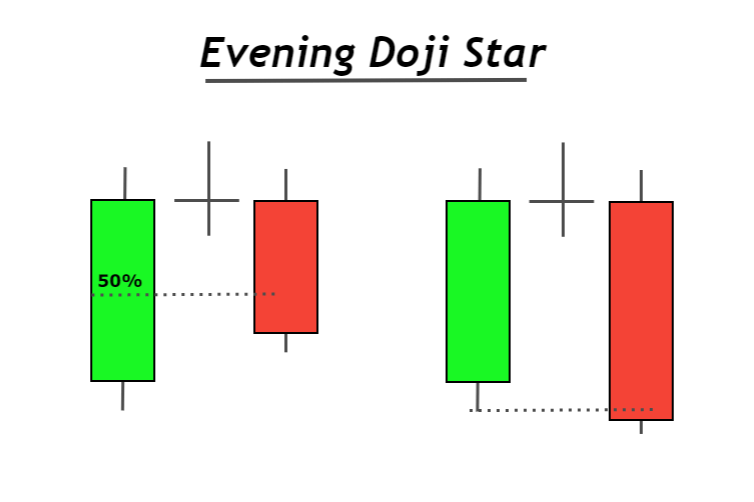 |
| Rising three methods | Buy | 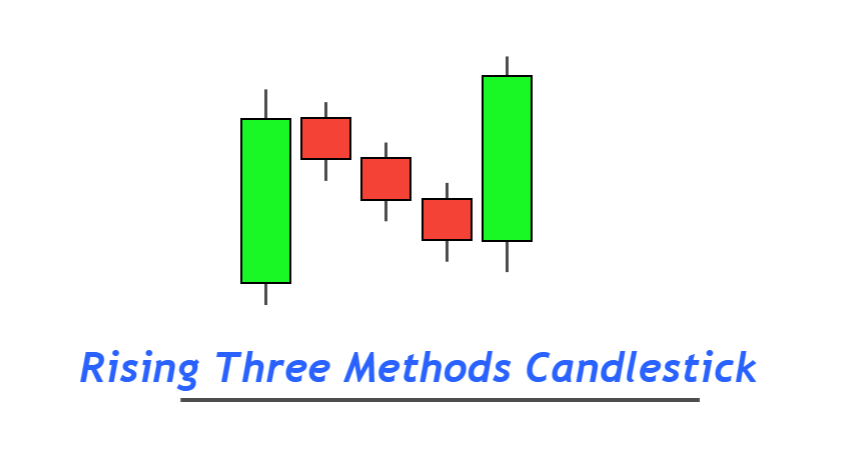 |
| Falling three methods | Sell | 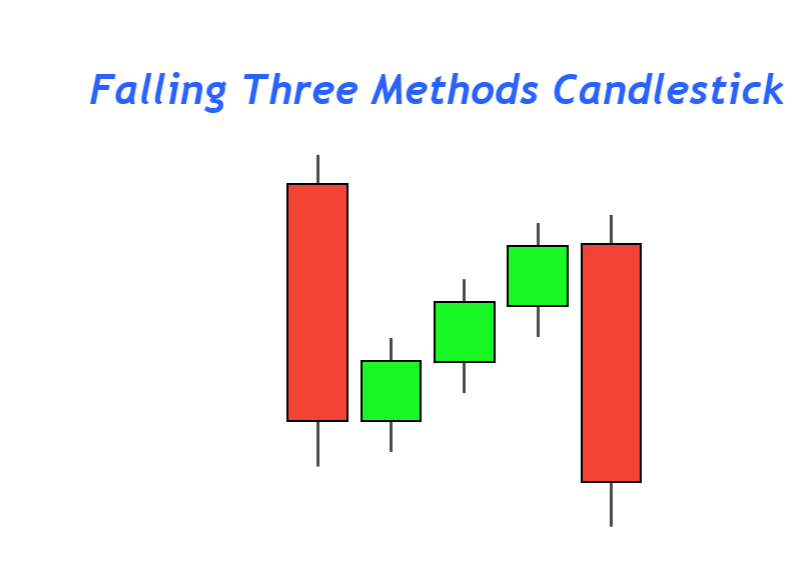 |
| Bullish abandoned baby | Buy | 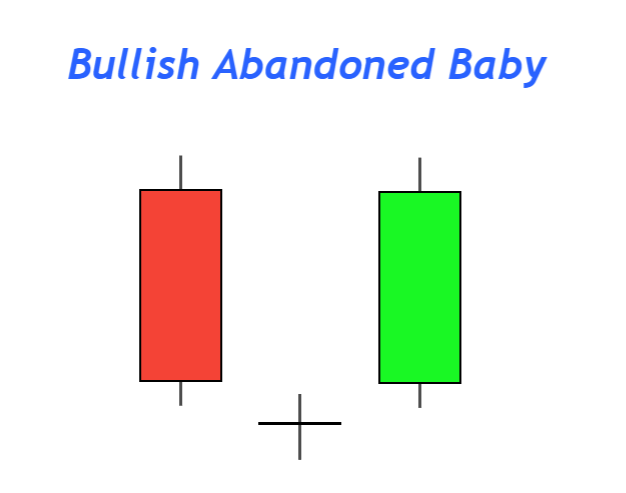 |
| Bearish abandoned baby | Sell | 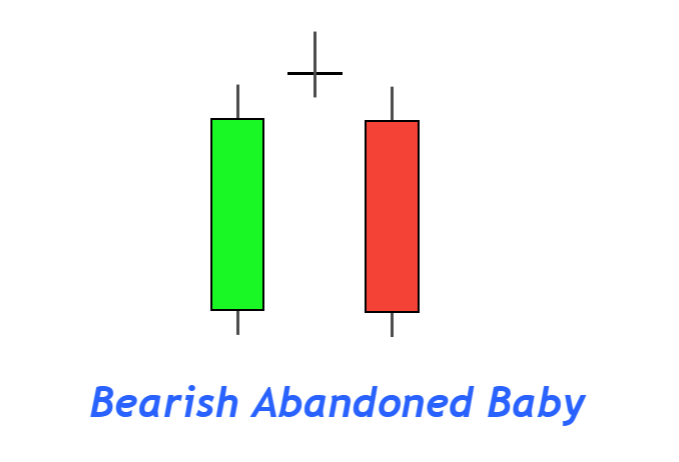 |
| Bearish piercing | Sell | 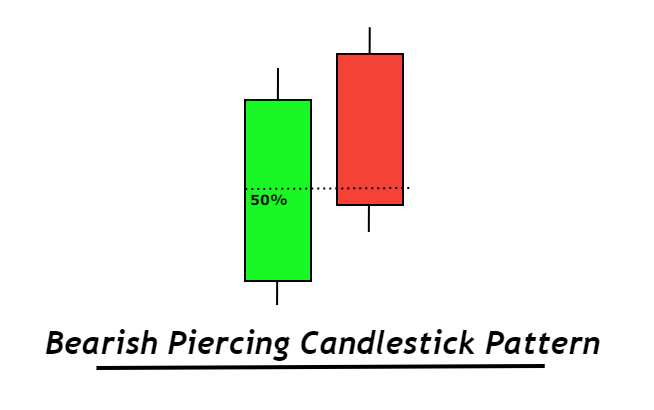 |
| Three white soldiers | Buy | 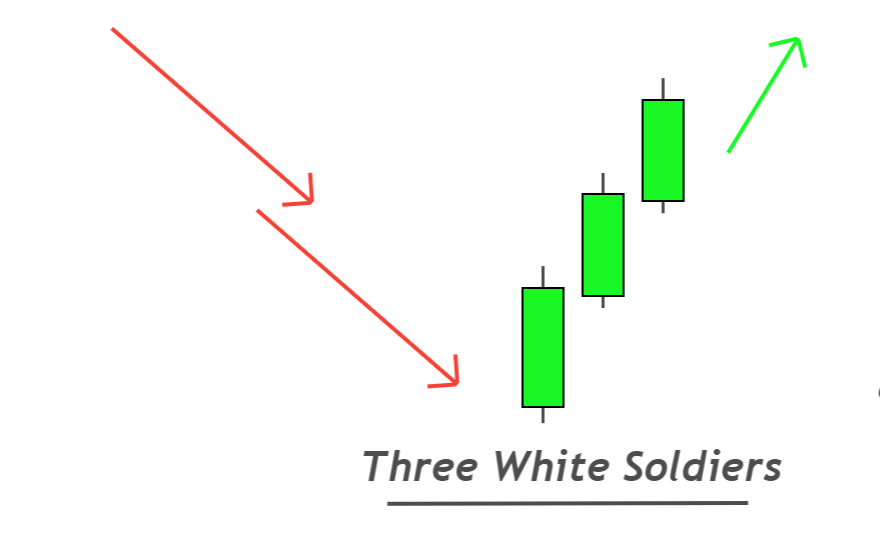 |
| Three black crows | Sell | 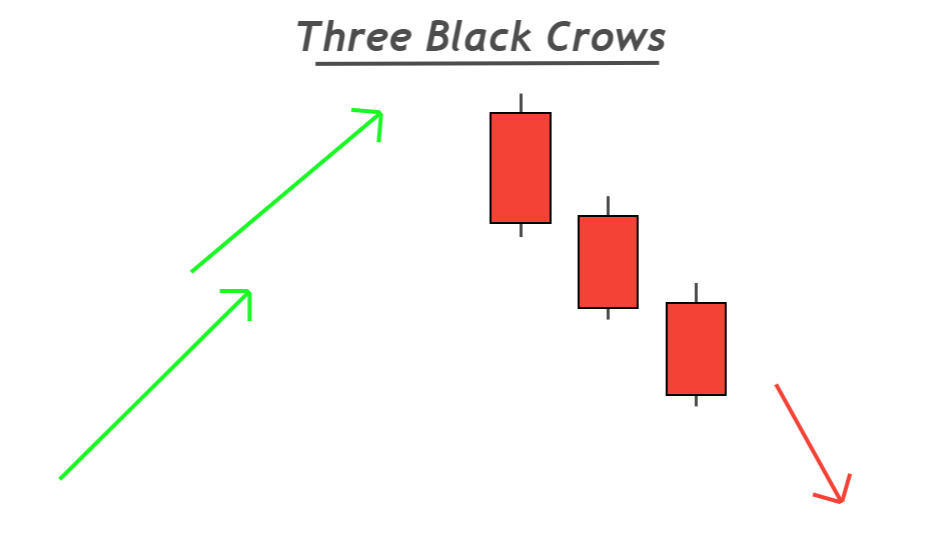 |
| High wave | Buy/Sell | 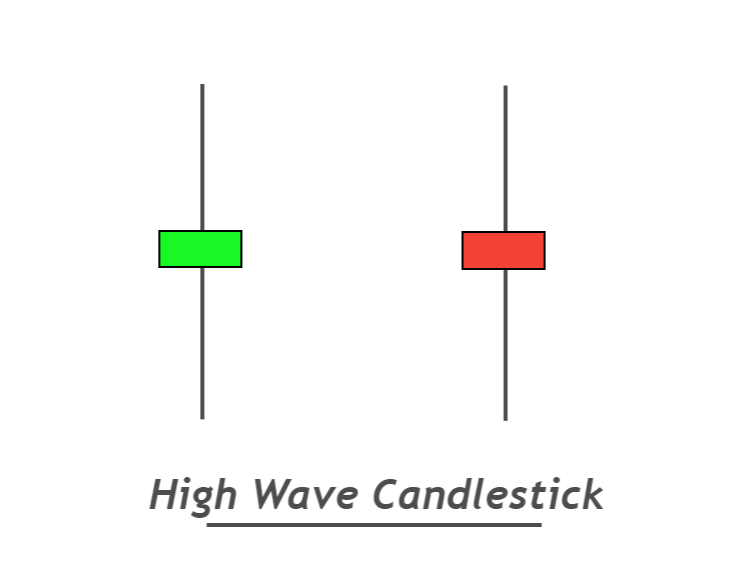 |
| Three star in south | Buy |  |
| Deliberation | Sell | 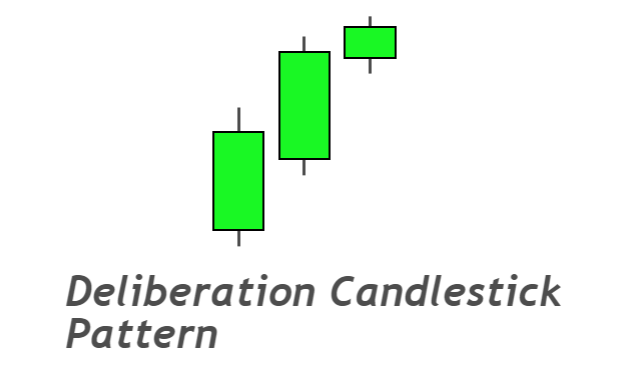 |
| Bearish kicking | Sell | 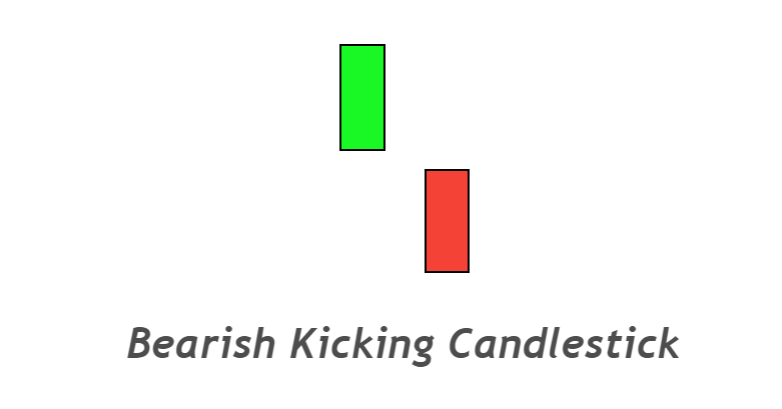 |
| On neck candlestick | Sell | 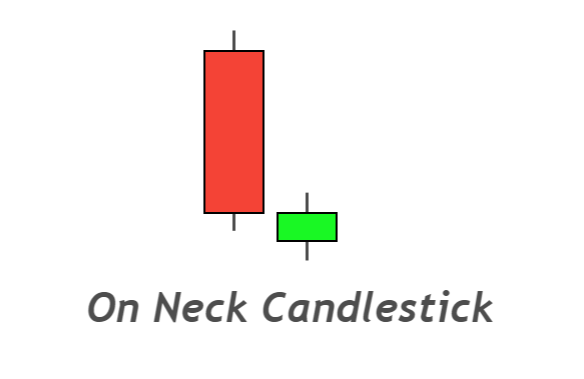 |
| Upside Tasuki gap | Buy | 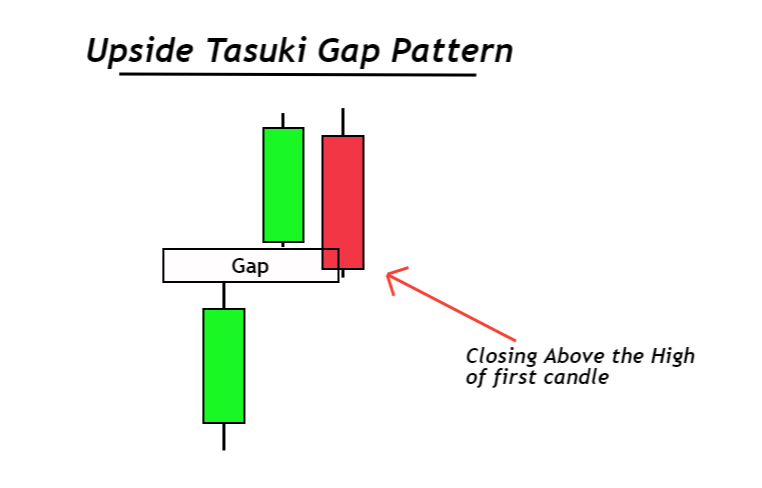 |
| Separating lines candlestick | Buy | 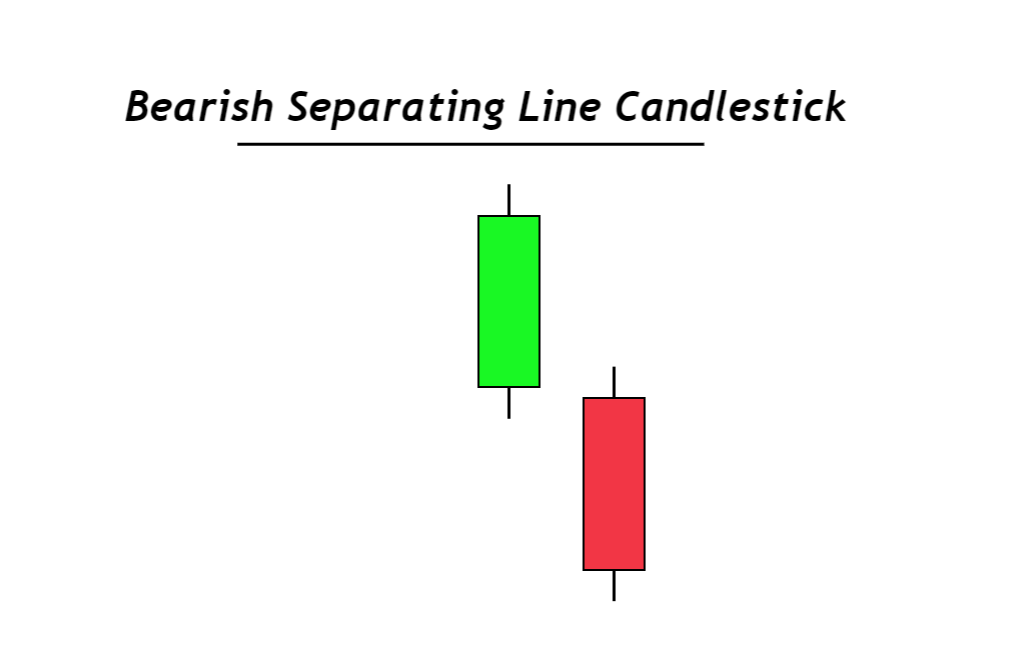 |
| Downside tasuki gap | Sell | 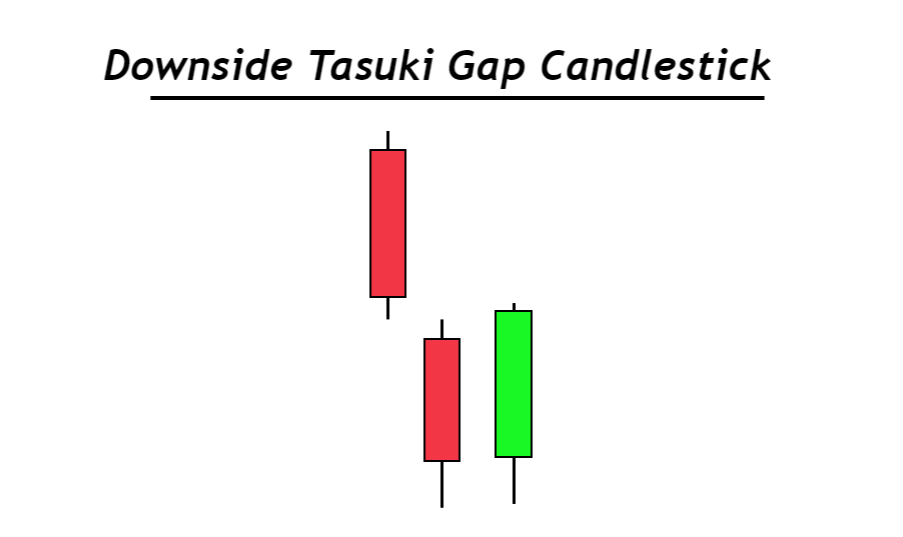 |
| Bearish breakaway | Sell | 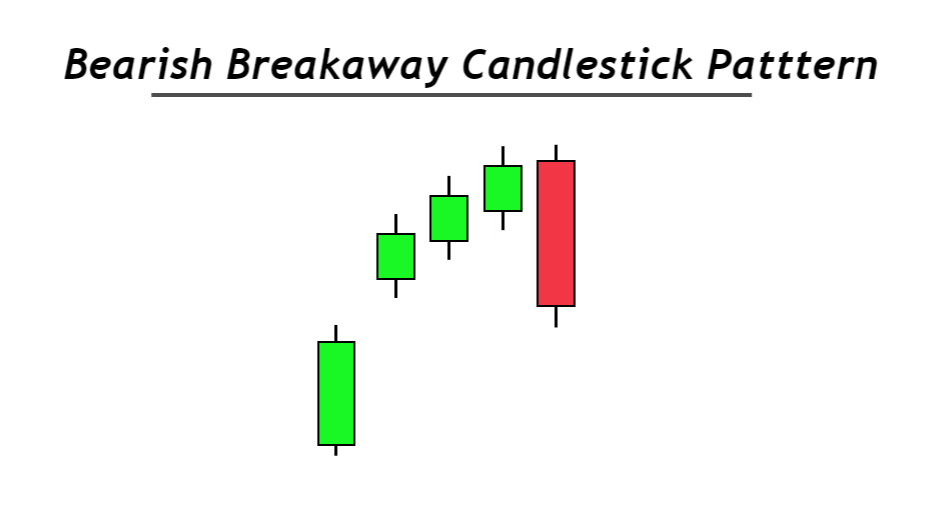 |
| Bullish kicker | Buy | 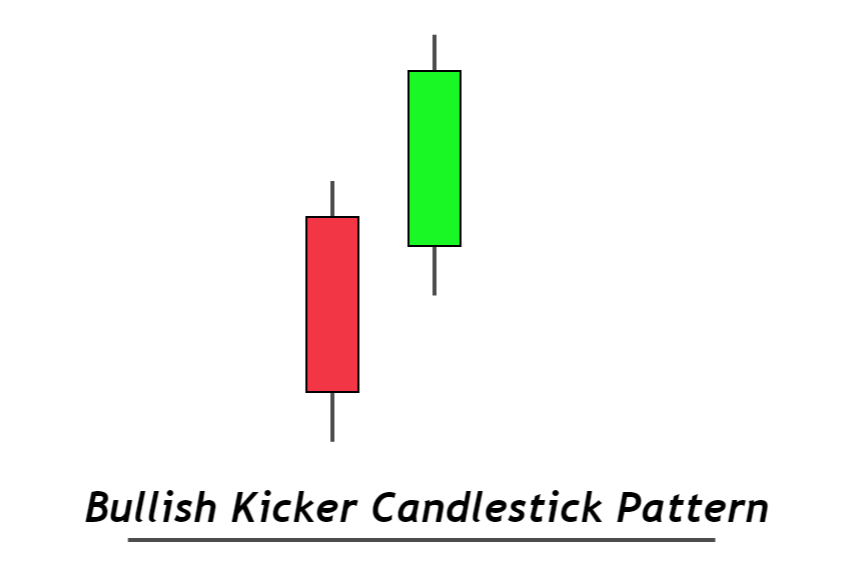 |
| Bullish mat hold | Buy | 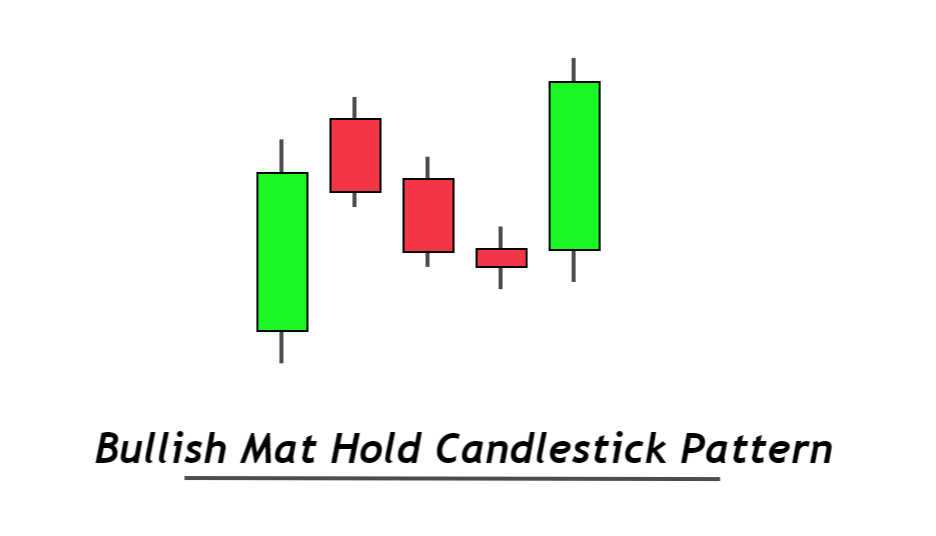 |
| Advance block | Sell | 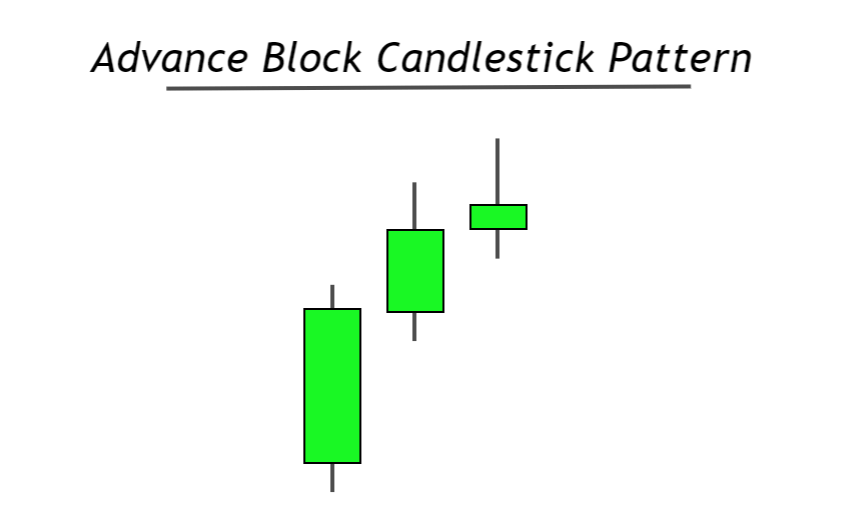 |
| Matching high | Sell | 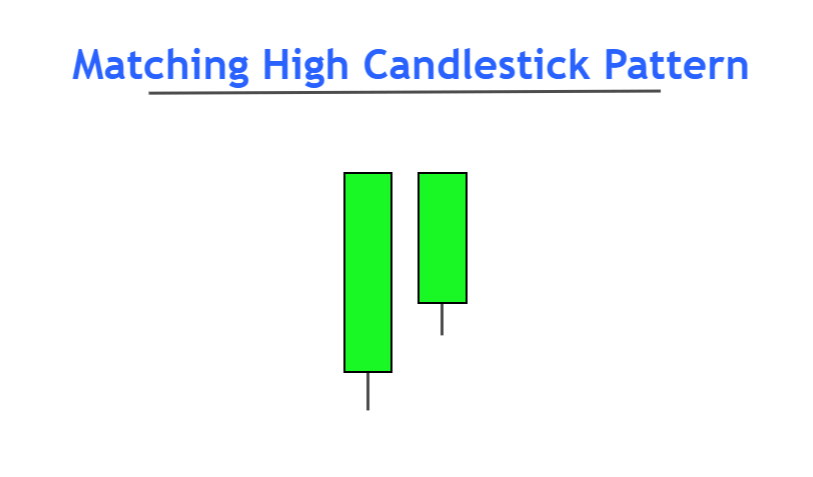 |
| Matching low candlestick | Buy | 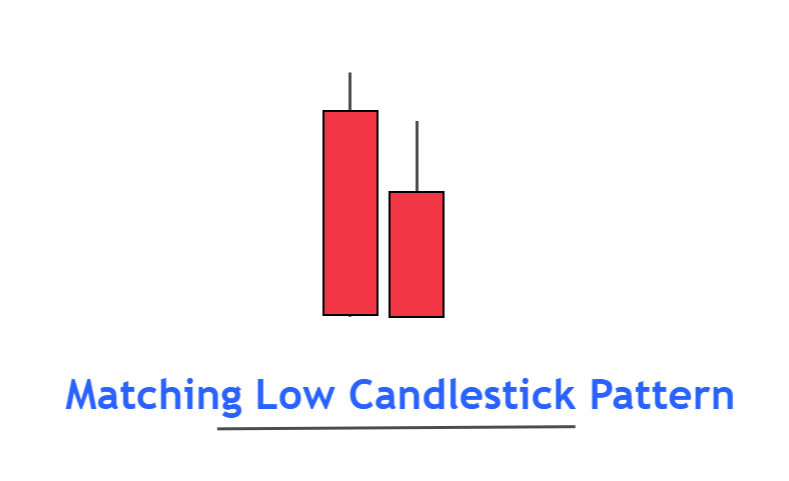 |
| Tower bottom candlestick | Buy | 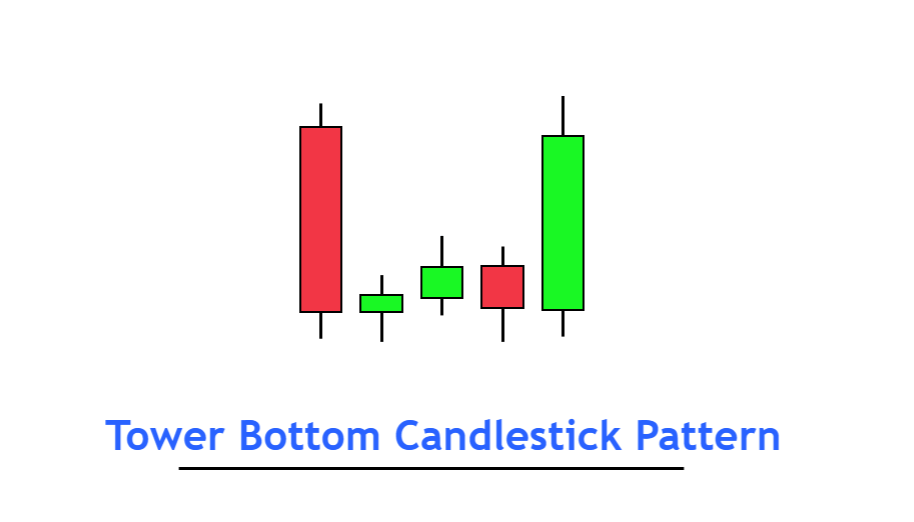 |
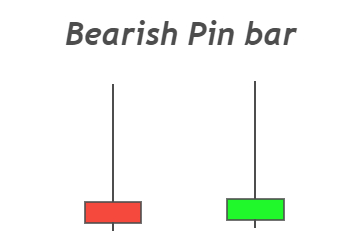
Pin bar
A pin bar candlestick is a trend reversal candlestick pattern that has a small body with a long tail on the upper or lower side. The color of candlestick does not matter in pin bar candles.
it is further divided into two types
- Bullish pin bar: The long tail will form below the body of candlestick
- Bearish pin bar: The long tail will form above the body of candlestick
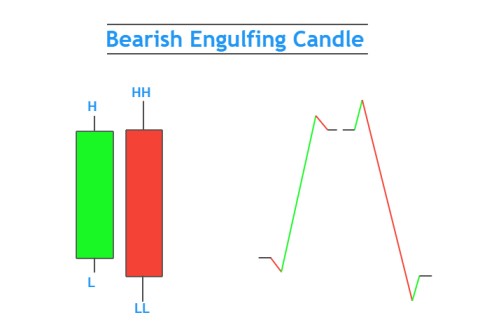
Engulfing
Engulfing candle refers to a candlestick that fully engulfs the previous candle. There are further two types of engulfing candles.
- Bullish engulfing
- Bearish engulfing
For better results in engulfing pattern, the body of the previous candlestick should be fully engulfed by the recent candlestick.
Inside bar
Inside bar refers to a candlestick pattern that consists of two candlesticks in which the most recent candlestick will form within the range of the previous candle.
It shows the indecision in the market. the market decides its direction by breaking the inside bar candle.
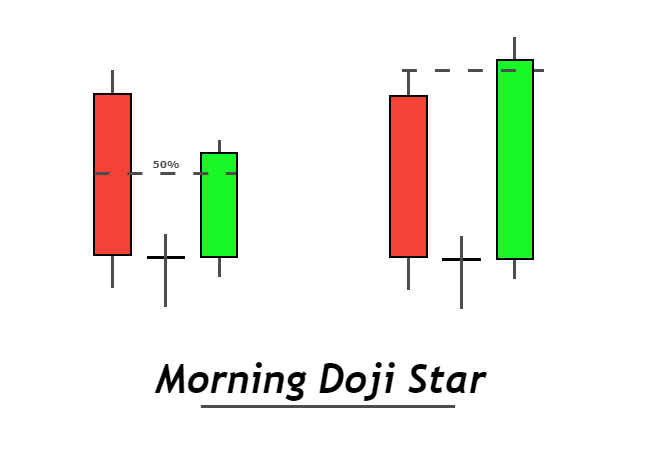
Morning Doji Star
Morning Doji Star is a three candlestick pattern that consists of a bearish candlestick, a Doji candle, and a bullish candlestick in a series. This is a bearish trend reversal candlestick pattern and a bullish candlestick.
it consists of three candlesticks and it will form at the bottom of the price chart.
Long legged Doji
Long-legged Doji candlestick is a type of Doji candlestick that has a long lower and upper wick. All the Doji candlesticks have the same opening and closing price. The high and low make a difference between types of Doji.
Long-legged Doji represents indecision in the market.
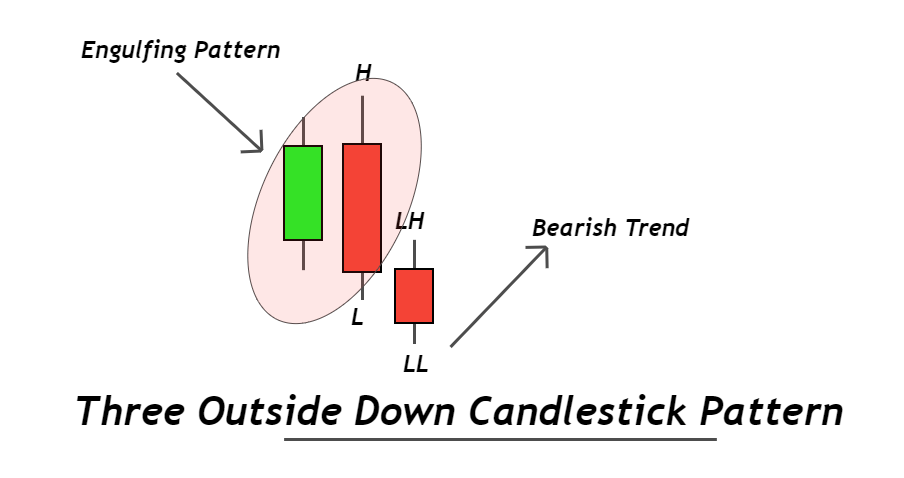
Three Outside Down
Three outside down is a bearish candlestick pattern that consists of three candlesticks in a specific pattern indicating a bullish trend reversal.
Engulfing candlestick acts as an outside bar and then a small candlestick making a lower low confirms that bullish trend has been changed into a bearish trend.
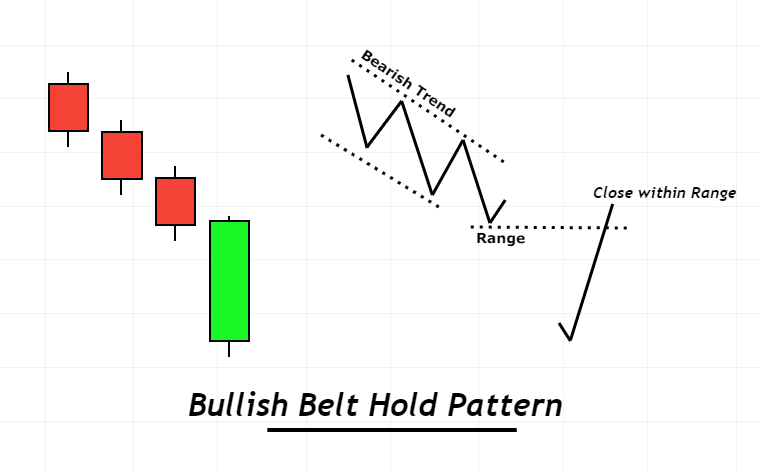
Bullish belt hold
Bullish belt hold is a candlestick pattern in which after three consecutive lower lows, a big bullish candlestick opens with a gap making a new lower low and then closing within the range of the previous candlestick.
it is a trend reversal candlestick pattern.
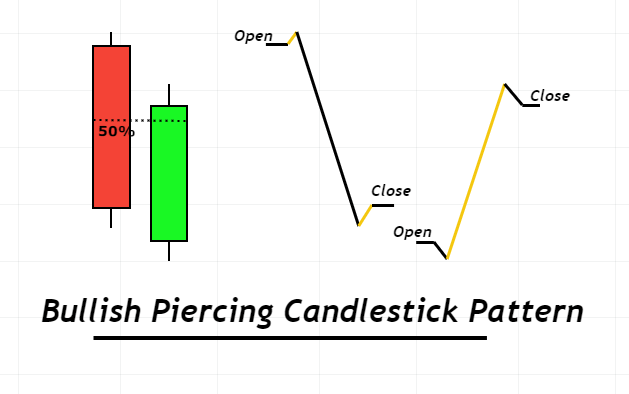
Bullish Piercing
The bullish piercing pattern is a bullish trend reversal candlestick pattern that consists of two candlesticks and the recent candlestick closes above the 50% level of the previous candlestick.
A piercing pattern is a simple candlestick pattern that also resembles a bullish pin bar on a higher timeframe.
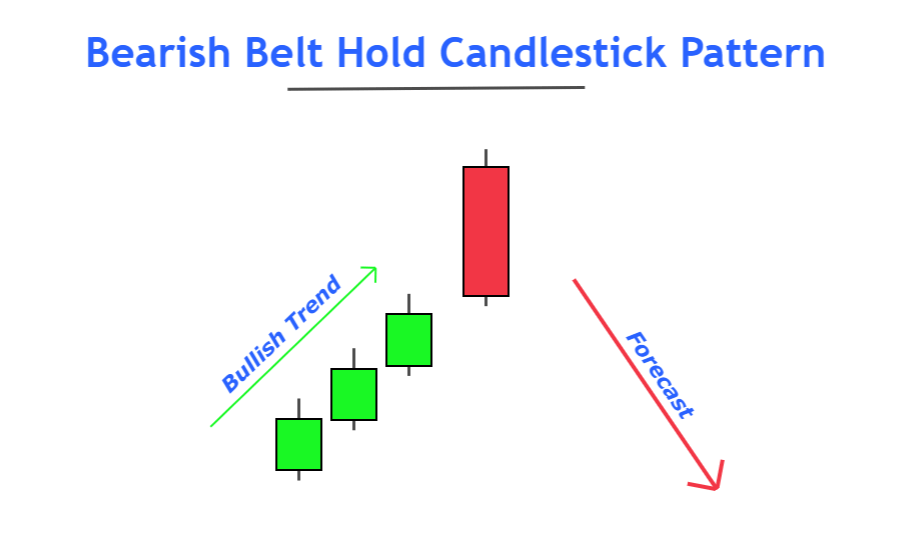
Bearish Belt Hold
Bearish belt hold is a trend reversal candlestick pattern that changes bullish price trend into the bearish price trend. After the formation of three bullish candlesticks, a long bearish candlestick forms at the top of the price chart resulting in a price trend reversal.
it is the opposite pattern to the bullish belt hold.
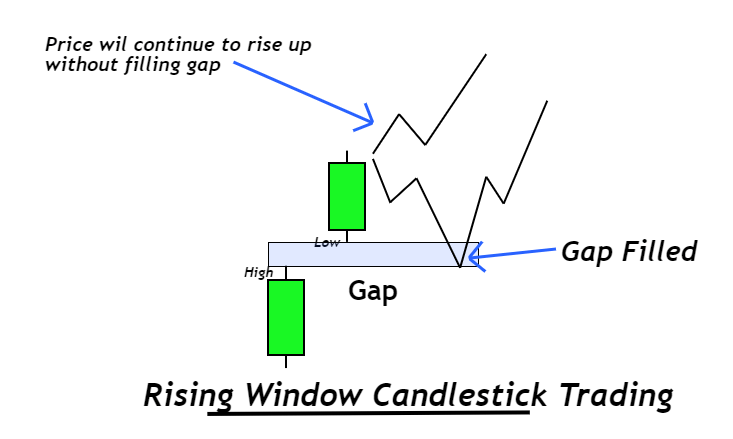
Rising Window
The rising window is a candlestick pattern that consists of two bullish candlesticks with a gap between them. The gap is a space between the high and low of two candlesticks. it occurs due to high trading volatility.
It is a trend continuation pattern
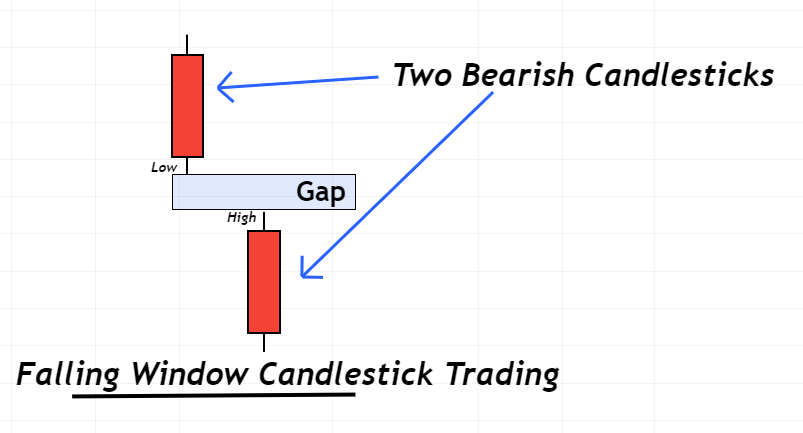
Falling Window
The falling window is a candlestick pattern that consists of two bearish candlesticks with a down gap between them. The down gap is a space between the high of the recent candlestick and the low of the previous candlestick.
it is a bearish continuation pattern.
Tweezer top
The tweezer top is a reversal candlestick pattern that consists of two opposite color candlesticks and the closing price of the first candlestick will be equal to the opening price of the second candlestick.
It is a reversal pattern that changes the price trend from bullish into bearish.
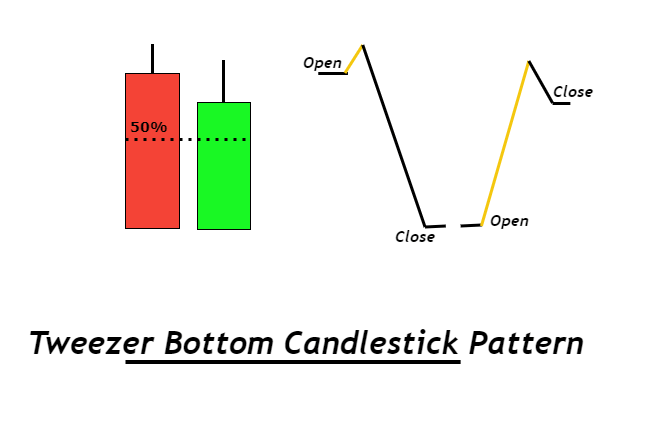
Tweezer Bottom
The tweezer bottom is a reversal candlestick pattern that consists of two opposite color candlesticks and the closing price of the first bearish candlestick will be equal to the opening price of the second bullish candlestick.
It is a bullish reversal candlestick pattern
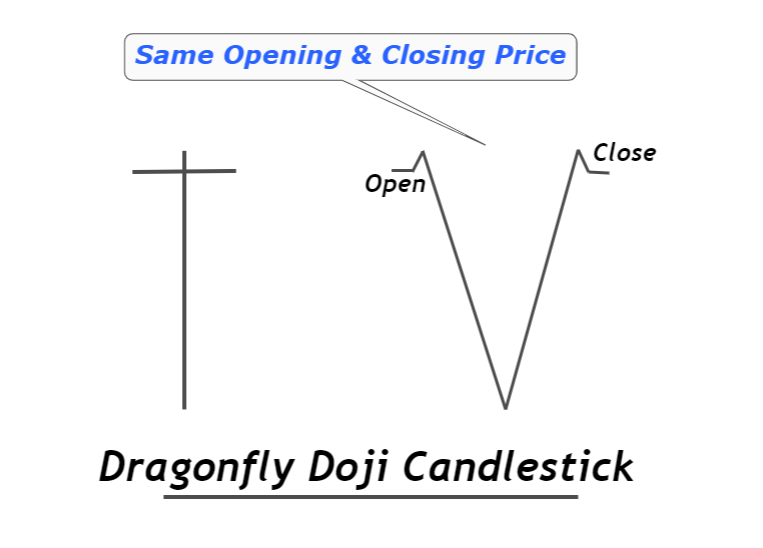
Dragonfly Doji
Dragonfly Doji is a type of Doji candlestick that represents indecision in the market, and it turns the bearish price trend into a bullish trend.
The large wick size indicates the false breakout that results in a trend reversal.
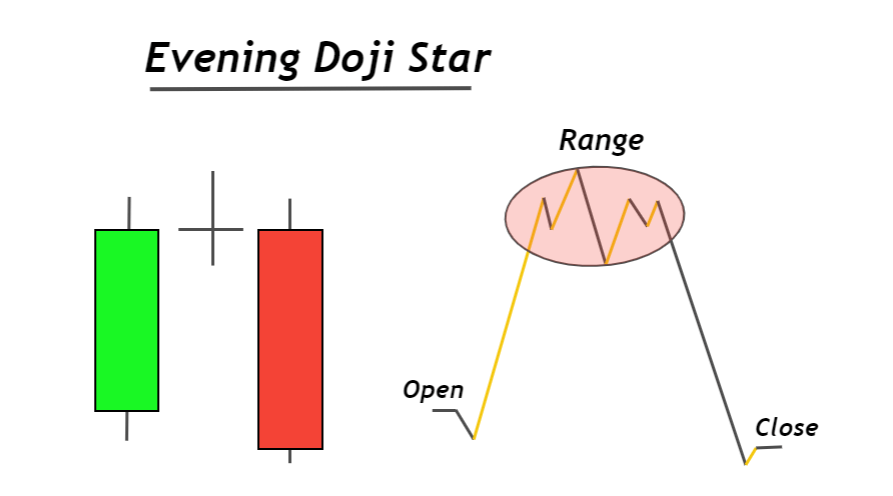
Evening Doji Star
Evening Doji Star is a three-candlestick pattern made up of a bullish candlestick, a Doji candle, and a bearish candlestick in series. It is a bullish trend reversal candlestick pattern.
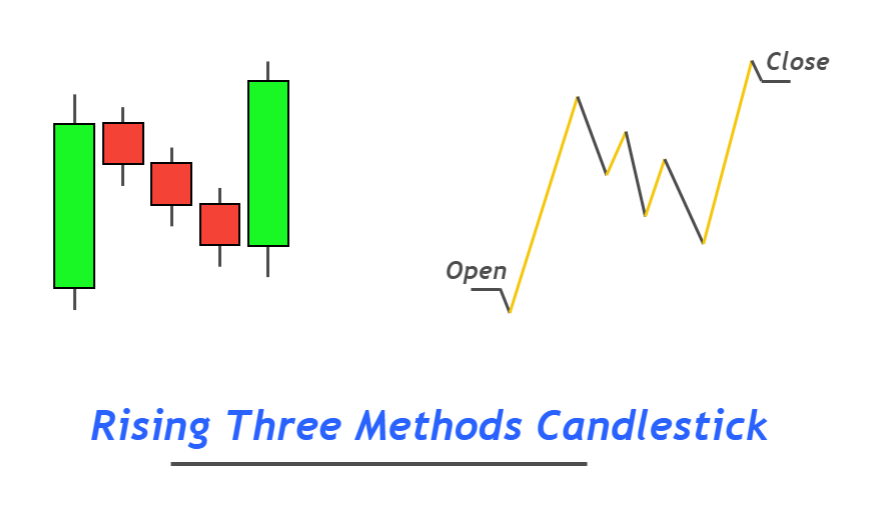
Rising Three Methods
Rising three methods is a trend continuation candlestick pattern that consists of five candlesticks on the price chart. It forms during trending market conditions and indicates that price will continue.
Rising three methods candlestick pattern helps a trader make critical trade management decisions like either holding a specific trade or closing that trade instantly.
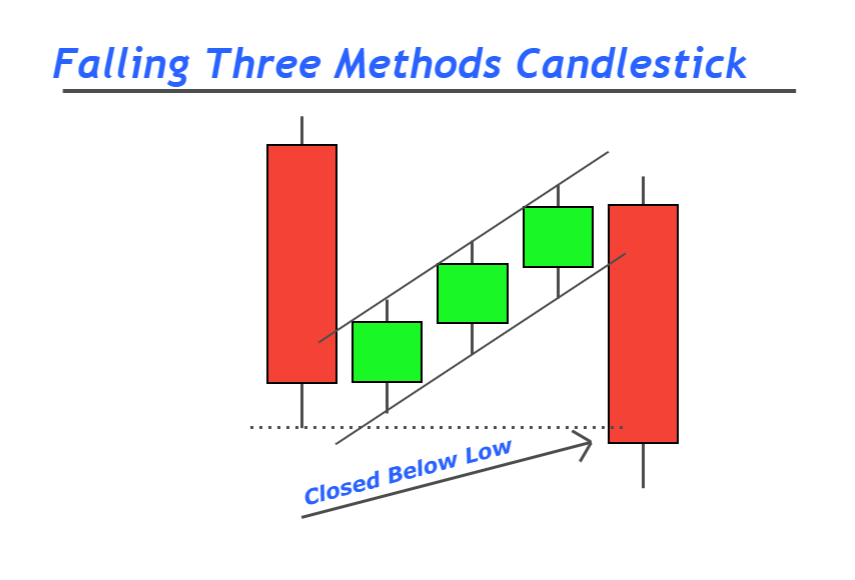
Falling Three Method
Falling three methods is a trend continuation bearish candlestick pattern that consists of five candlesticks. It represents that the previous bearish trend will continue, decreasing the price.
It is not a trend reversal candlestick pattern.
Bullish Abandoned Baby
A bullish abandoned baby is a trend reversal candlestick pattern that consists of a bullish candlestick, a Doji with a gap down, and a bearish candlestick.
This candlestick pattern rarely forms on the price chart. Usually, you will see this pattern in the price chart of stocks and indices.
Bearish Abandoned Baby
A bearish abandoned baby is a trend reversal candlestick pattern made up of a bearish candlestick, a bullish candlestick, and a Doji. A gap forms before and after the Doji candlestick, and Doji candlestick forms between bearish and bullish candlestick.
More than one Doji candlesticks in an abandoned baby pattern can also form between bullish and bearish candlestick.
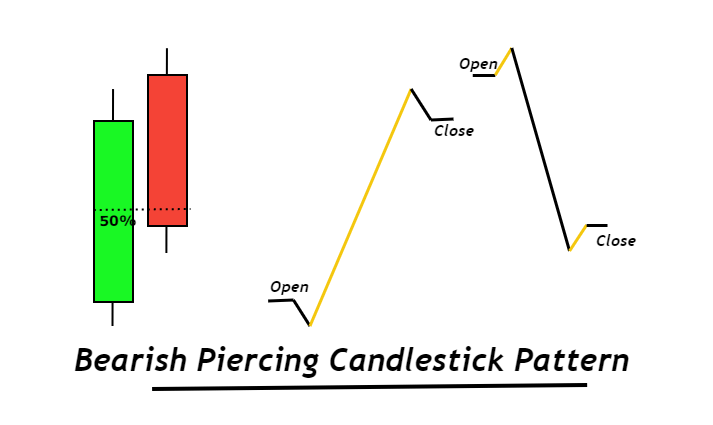
Bearish Piercing
The bearish piercing pattern is a bearish trend reversal candlestick pattern that consists of two opposite color candlesticks with a price gap in between them. In this pattern, the bearish candlestick will close below the 50% level of the previous bullish candlestick.

Find High Probability Trades with this ADVANCED Candlestick Patterns Course
The Ultimate Candlestick Patterns Course That Will Help You To Trade Better
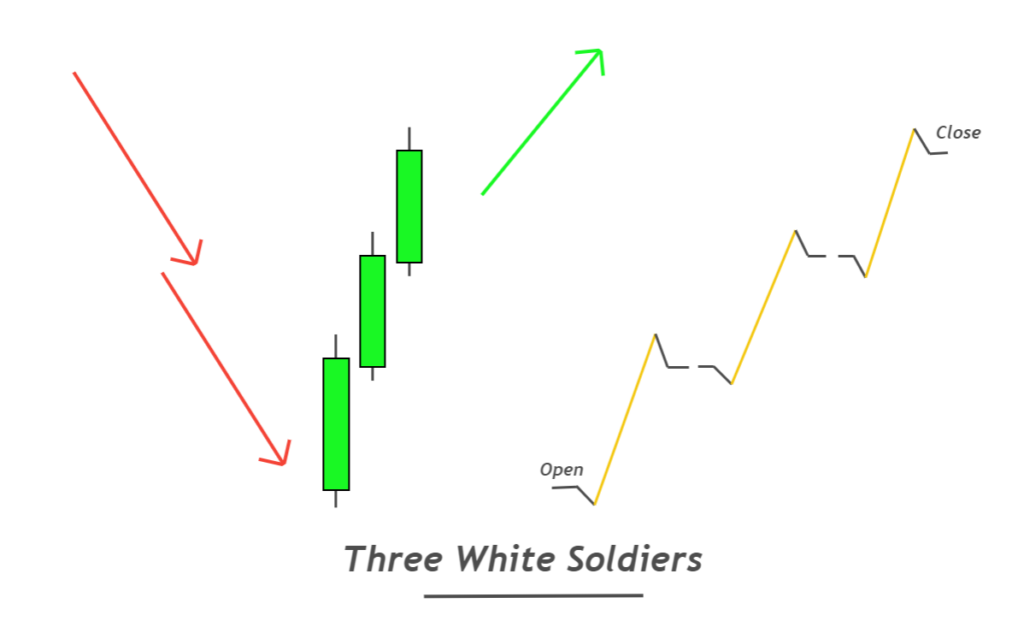
Three White Soldiers
Three white soldiers is a bullish trend reversal candlestick pattern that consists of three bullish candlesticks making higher highs and high lows. These candlesticks form in series with small wicks and shadows representing a massive momentum of sellers.
The three black crows candlestick pattern is opposite to the three white soldiers’ pattern.
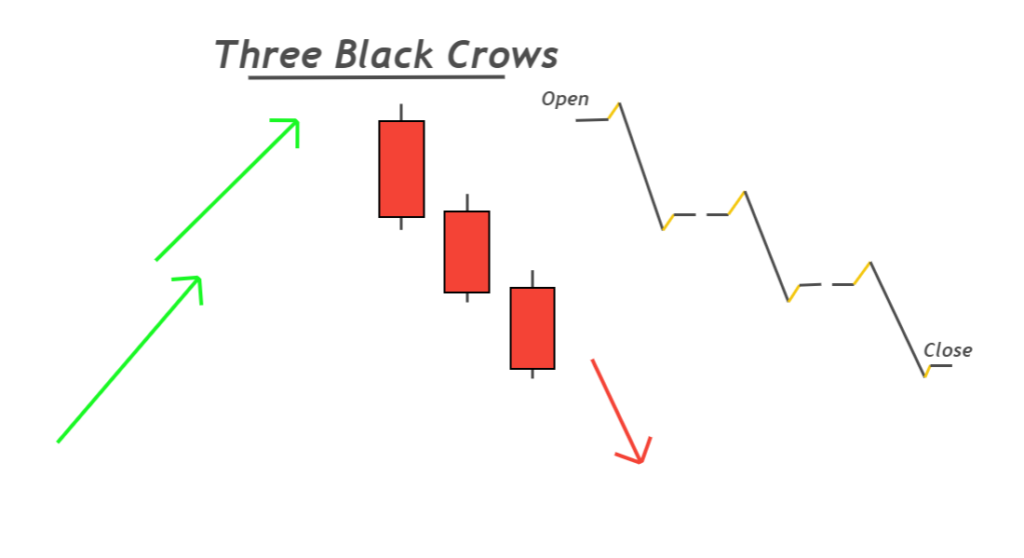
Three Black Crows
Three black crows is a bearish trend reversal candlestick pattern that consists of three big bearish candlesticks making lower lows and lower highs.
Three black crows candlestick patterns should form at the top of the price uptrend to get a high winning rate.
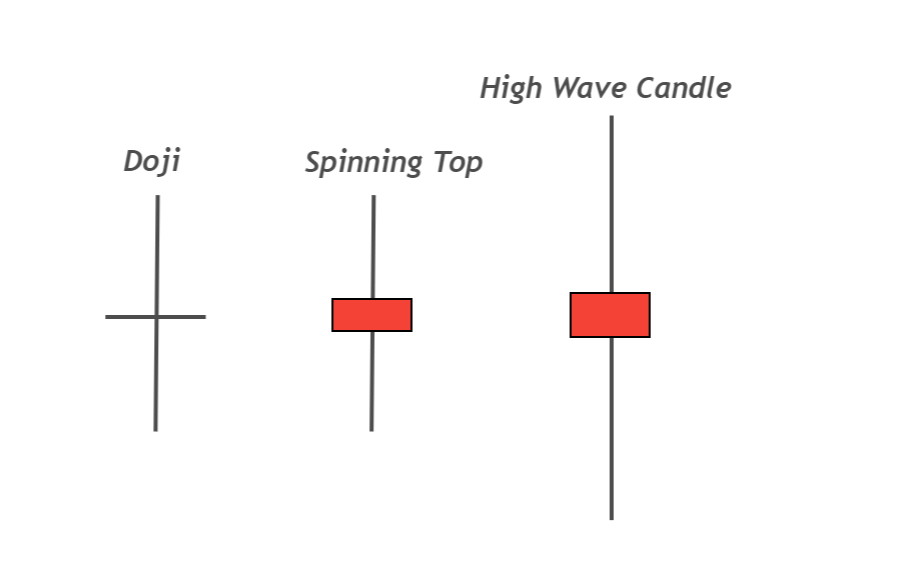
High Wave
The High wave pattern is a candlestick pattern with large wicks/shadows than the average size of candlestick. The body of the candlestick is tiny as compared to the shadows.
It is like a spinning top or long-legged Doji candlestick.
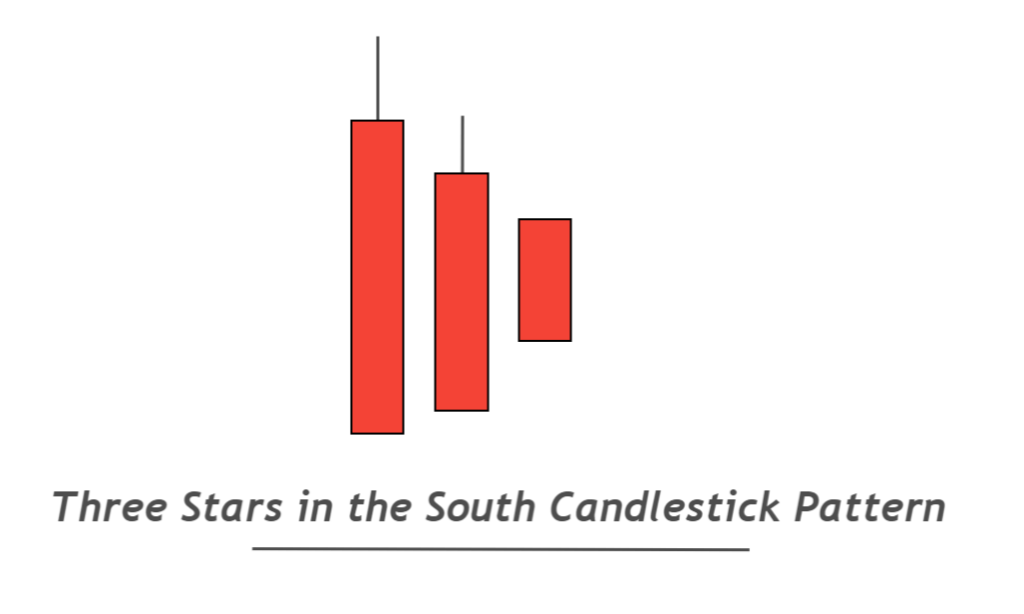
Three Stars in the South
The Three Stars in the south is a bullish reversal candlestick pattern made up of three bearish candlesticks. In this candlestick pattern, each candlestick forms within the range of the previous candlestick.
The structure of this pattern also relates to the inside bar candlestick pattern,
Deliberation
Deliberation Candlestick pattern is a trend reversal candlestick pattern made of three consecutive bullish candlesticks in a proper sequence. This candlestick pattern is also known as stalled candlestick pattern.
Bearish Kicking
Bearish kicking is a price trend reversal candlestick pattern consisting of two opposite-colored marubozu candlesticks with a gap between them. It will mostly form at the top of the price chart or Resistance/supply level.
The bearish kicking candle is used to forecast an upcoming bearish trend in the market.
On Neck
The On-neck pattern is a candlestick pattern in which after a long bearish candlestick, a small candlestick will with a gap down, and it will close near the opening price of the previous big bearish candlestick.
It is a bearish trend continuation candlestick pattern
Upside Tasuki Gap
The upside Tasuki gap is a bullish trend continuation pattern that consists of three candlesticks and an upside gap.
This candlestick pattern tells retail traders that the market’s bullish trend will continue, and buyers are in control.
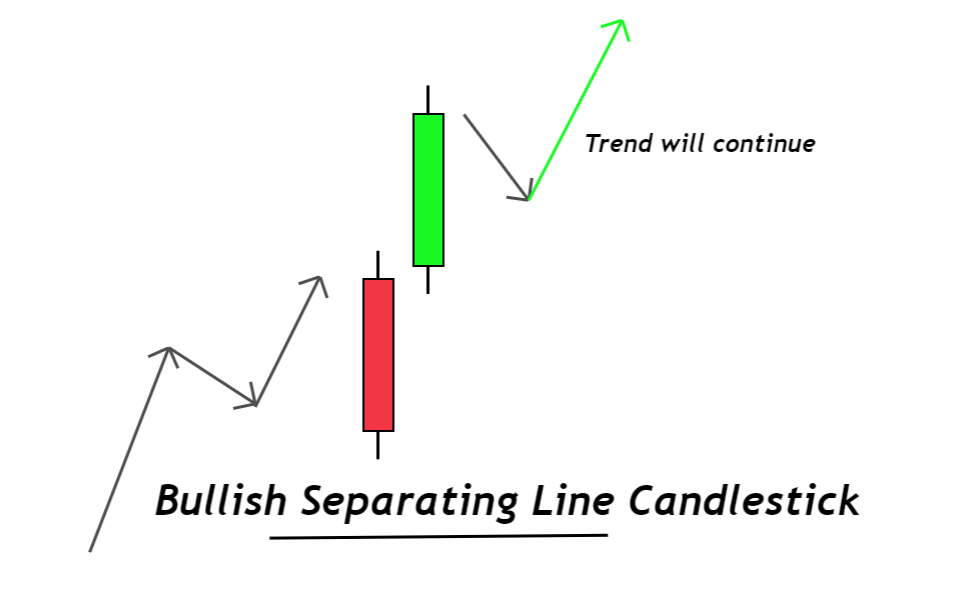
Separating Lines
The separating lines candlestick is a trend continuation pattern consisting of two opposite-colored candlesticks. The closing of the first candlestick will be equal to the opening price of the second candlestick.
It indicates that the previous trend will continue.
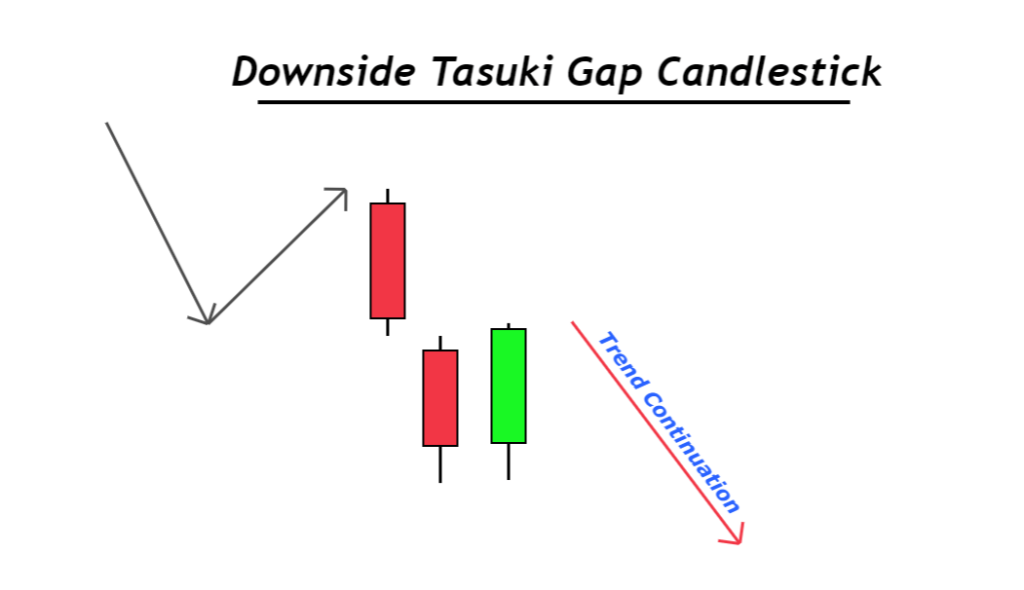
Downside Tasuki Gap
The Downside Tasuki gap is a continuation candlestick pattern that consists of three candlesticks with a downside gap. The downside gap will form within two bearish candlesticks.
It is a bearish trend continuation pattern representing the seller is in control.
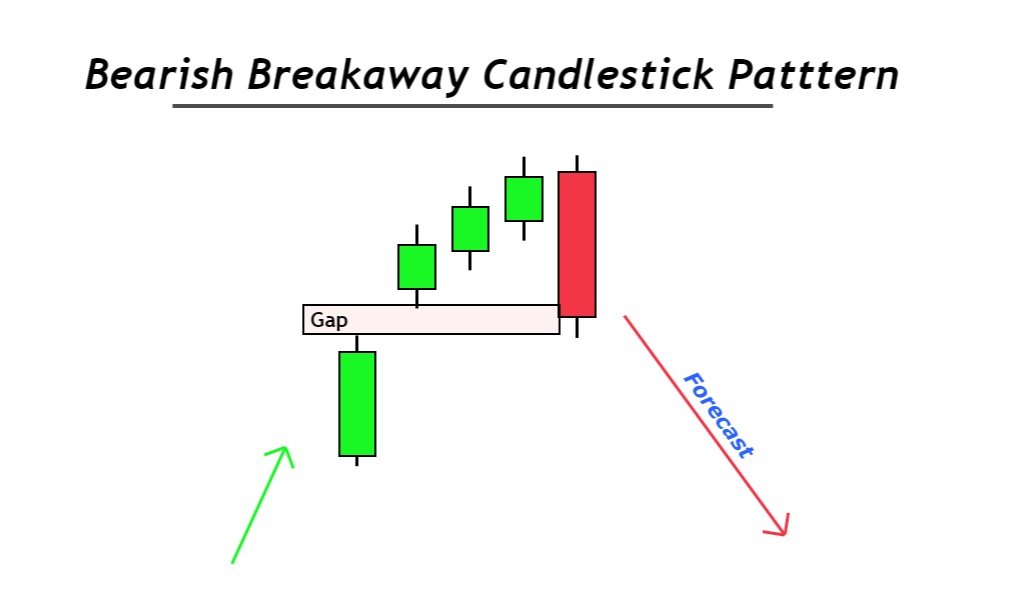
Bearish Breakaway
Bearish breakaway is a bearish reversal candlestick pattern that consists of five candlesticks and a gap zone. After forming this candlestick pattern, a bullish trend will turn into a bearish price trend.
Bullish Kicker
Bullish kicker candlestick is a bullish trend reversal candlestick pattern consisting of two opposite-colored candlesticks with a gap between them. It will turn the bearish trend into a bullish price trend.
Bullish mat hold
Bullish mat hold is a trend continuation candlestick pattern consisting of five candles and a gap. It shows that the previous trend will continue.
Bullish mat hold pattern primarily forms in stocks and indices.
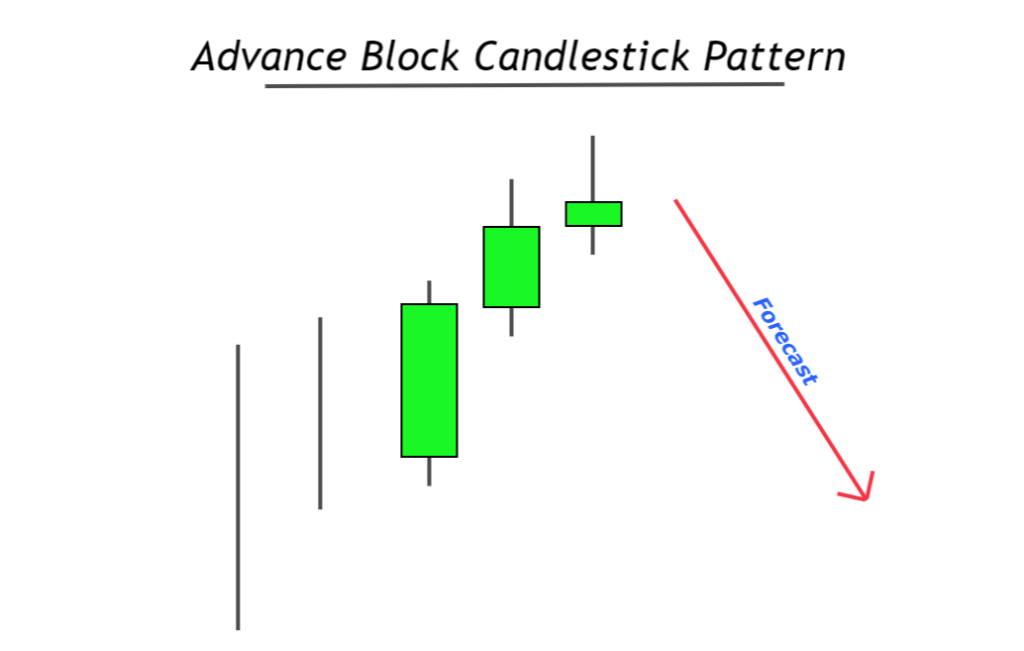
Advance Block
The advance block is a bearish reversal candlestick pattern that consists of three bullish candlesticks. It will turn the bullish price trend into a bearish trend. That’s why it will form at the top of the uptrend.
It is a single pattern that does not have an opposite pattern (bullish reversal) due to rare occurrences on the price chart.
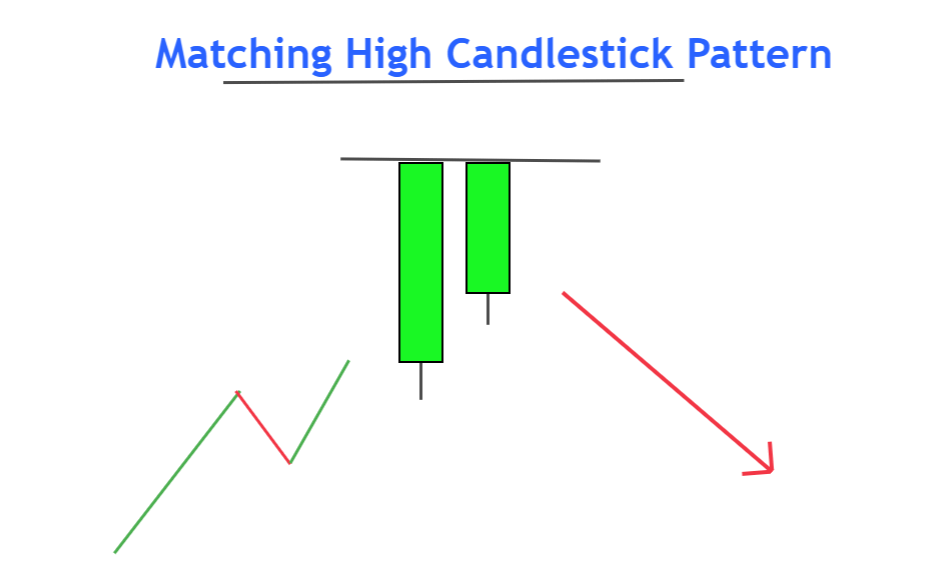
Matching High
Matching high is a bearish reversal candlestick pattern consisting of two bullish candlesticks with the same high and no shadows on the upper side.
The second candlestick opens with a gap down in this pattern.
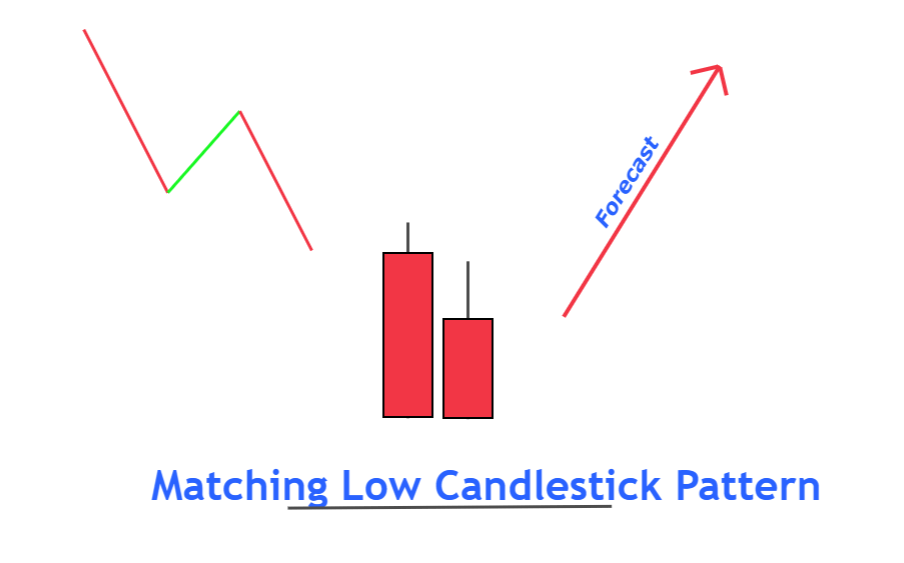
Matching Low
Matching low is a bullish trend reversal candlestick pattern that consists of two bearish candlesticks with the same closing price and no shadows on the lower side of candlesticks.
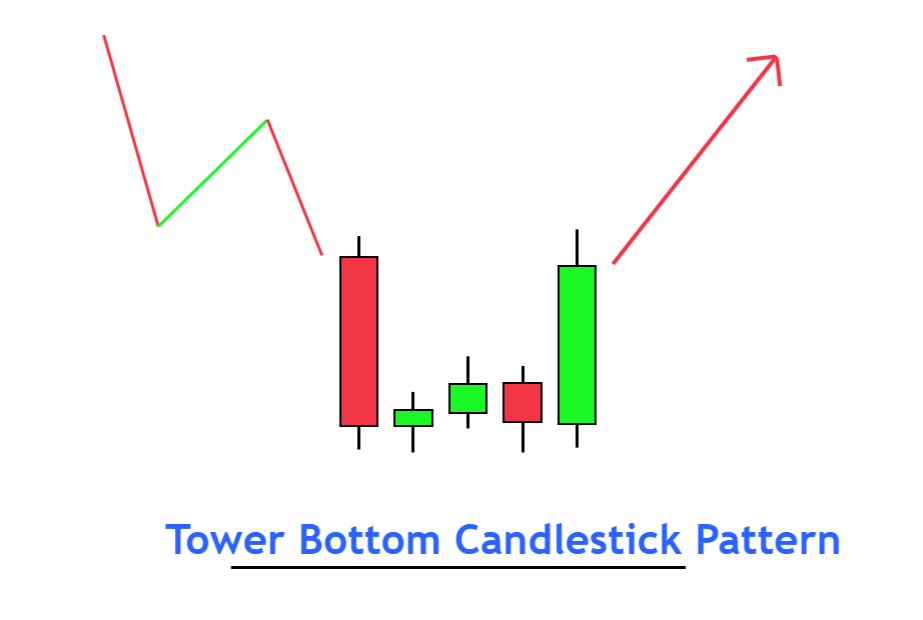
Tower Bottom
Tower bottom is a bullish trend reversal candlestick pattern of two opposite-color big candlesticks and three to five small base candlesticks.
Conclusion
The candlestick patterns are widely used by retail traders in technical analysis. These patterns were introduced by steve nison.
I will highly recommend using these candlestick patterns as a confluence with other technical tools for profitable results.
Remember to backtest a single pattern at least 50 times to become a Pro trader.
Nak berjaya dalam dunia trendingtapi Masih mc hey,sebab trep dgn takde ilmu,nk sngat ad org tolong ajarkan cara Cara kenal candle apeplease tolong respon,amat amat perlu bantuannk berjaya dlm bidang tranding macm org d luar sana bang
Interested to learn
Very ccolintroductionto candle patterns.
Nice
Thank you for great insight in so many different patterns.
thank you so much
THANK U
Hi Ali, thank you so much for your generosity in writing and sharing this information. What a Super Guy you are!
thank you
supperp
nice
thanks