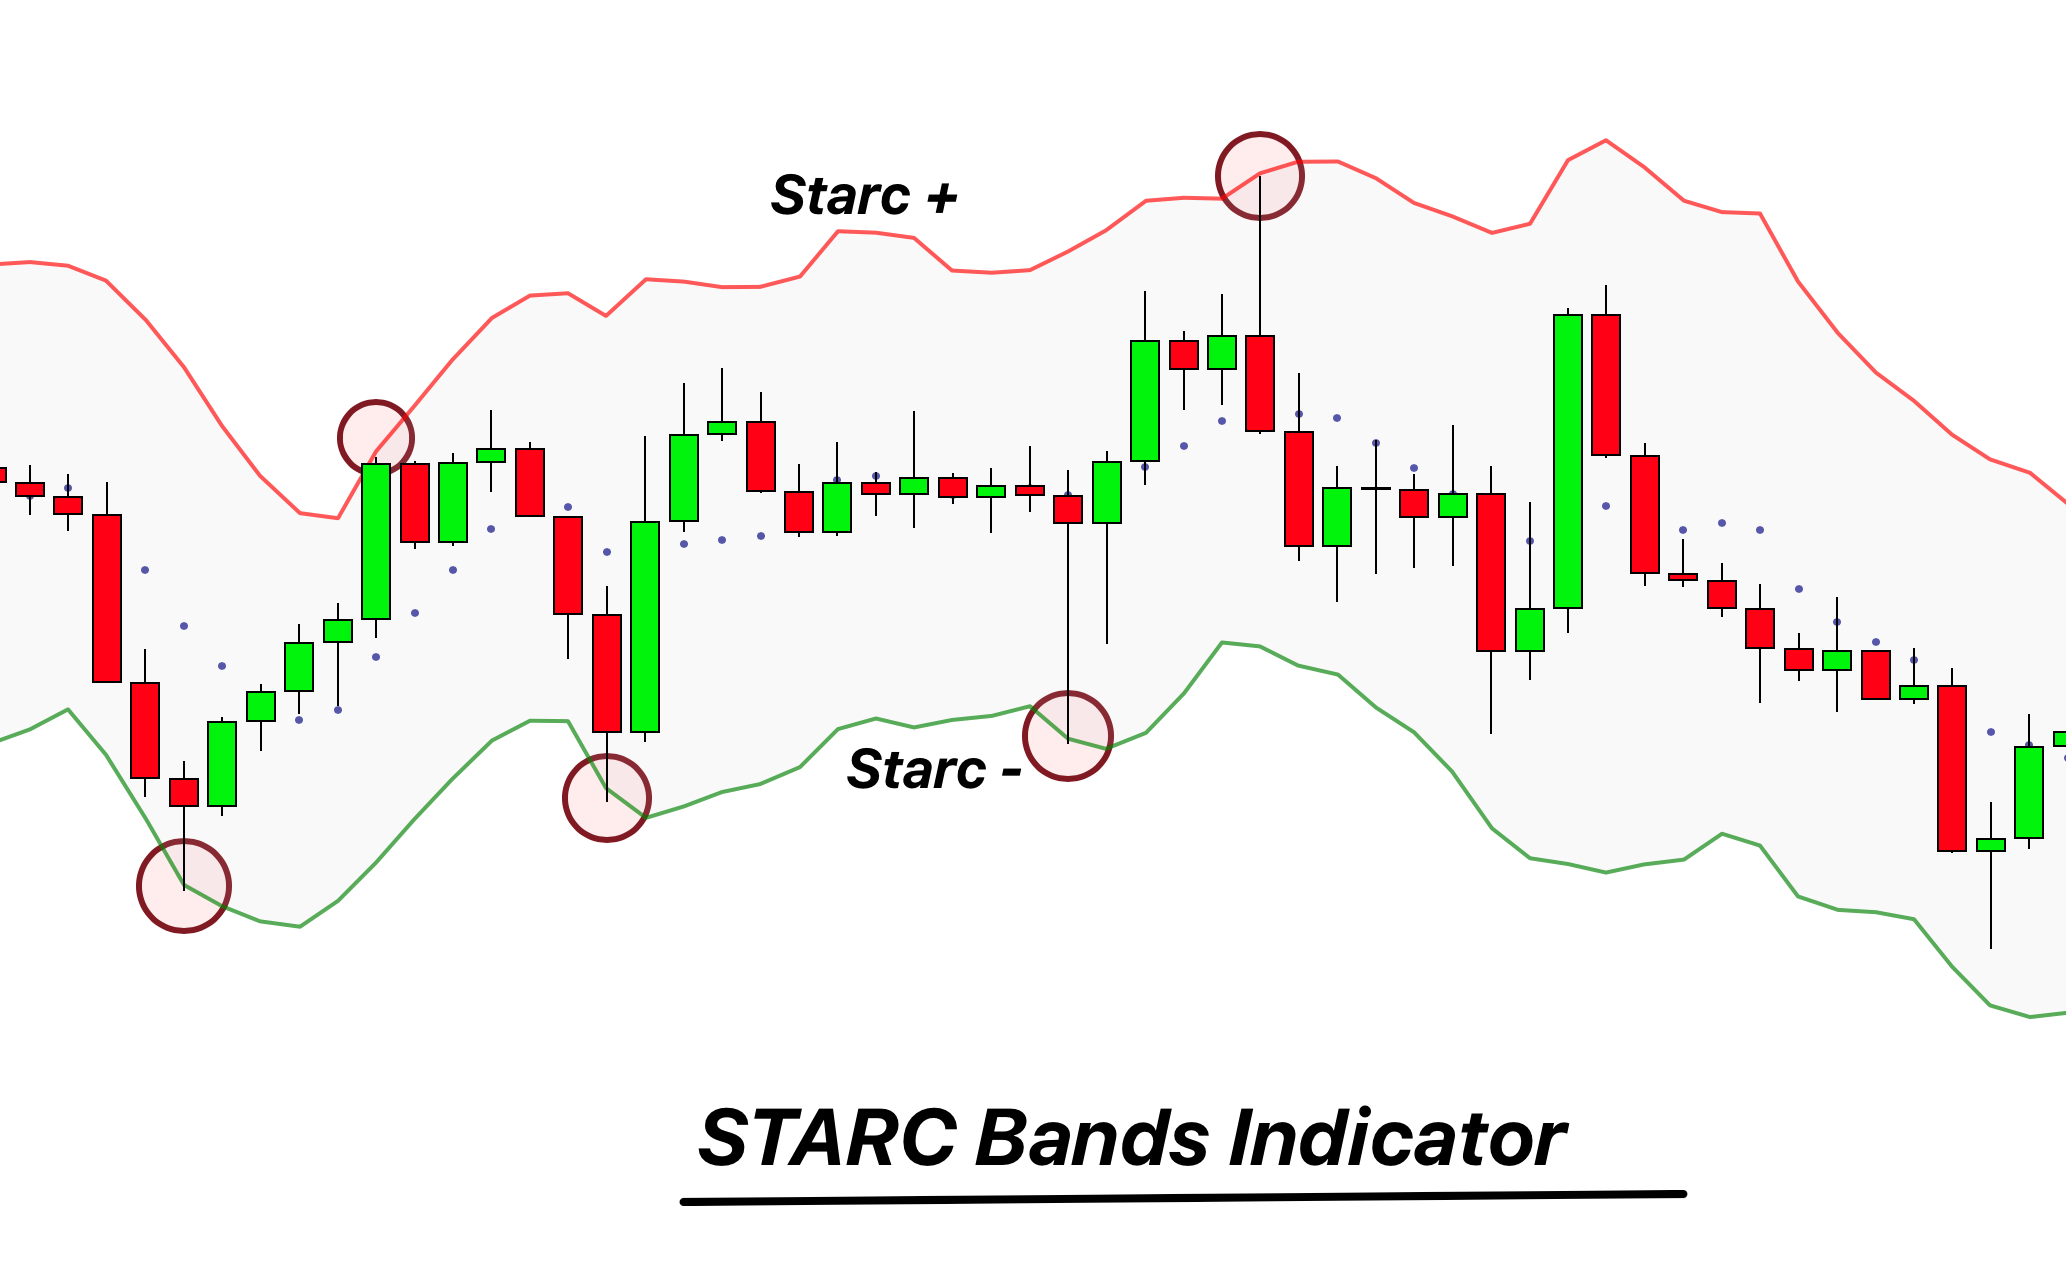
Introduction Starc bands indicator is a technical trading tool that provides sell and buy signals ...
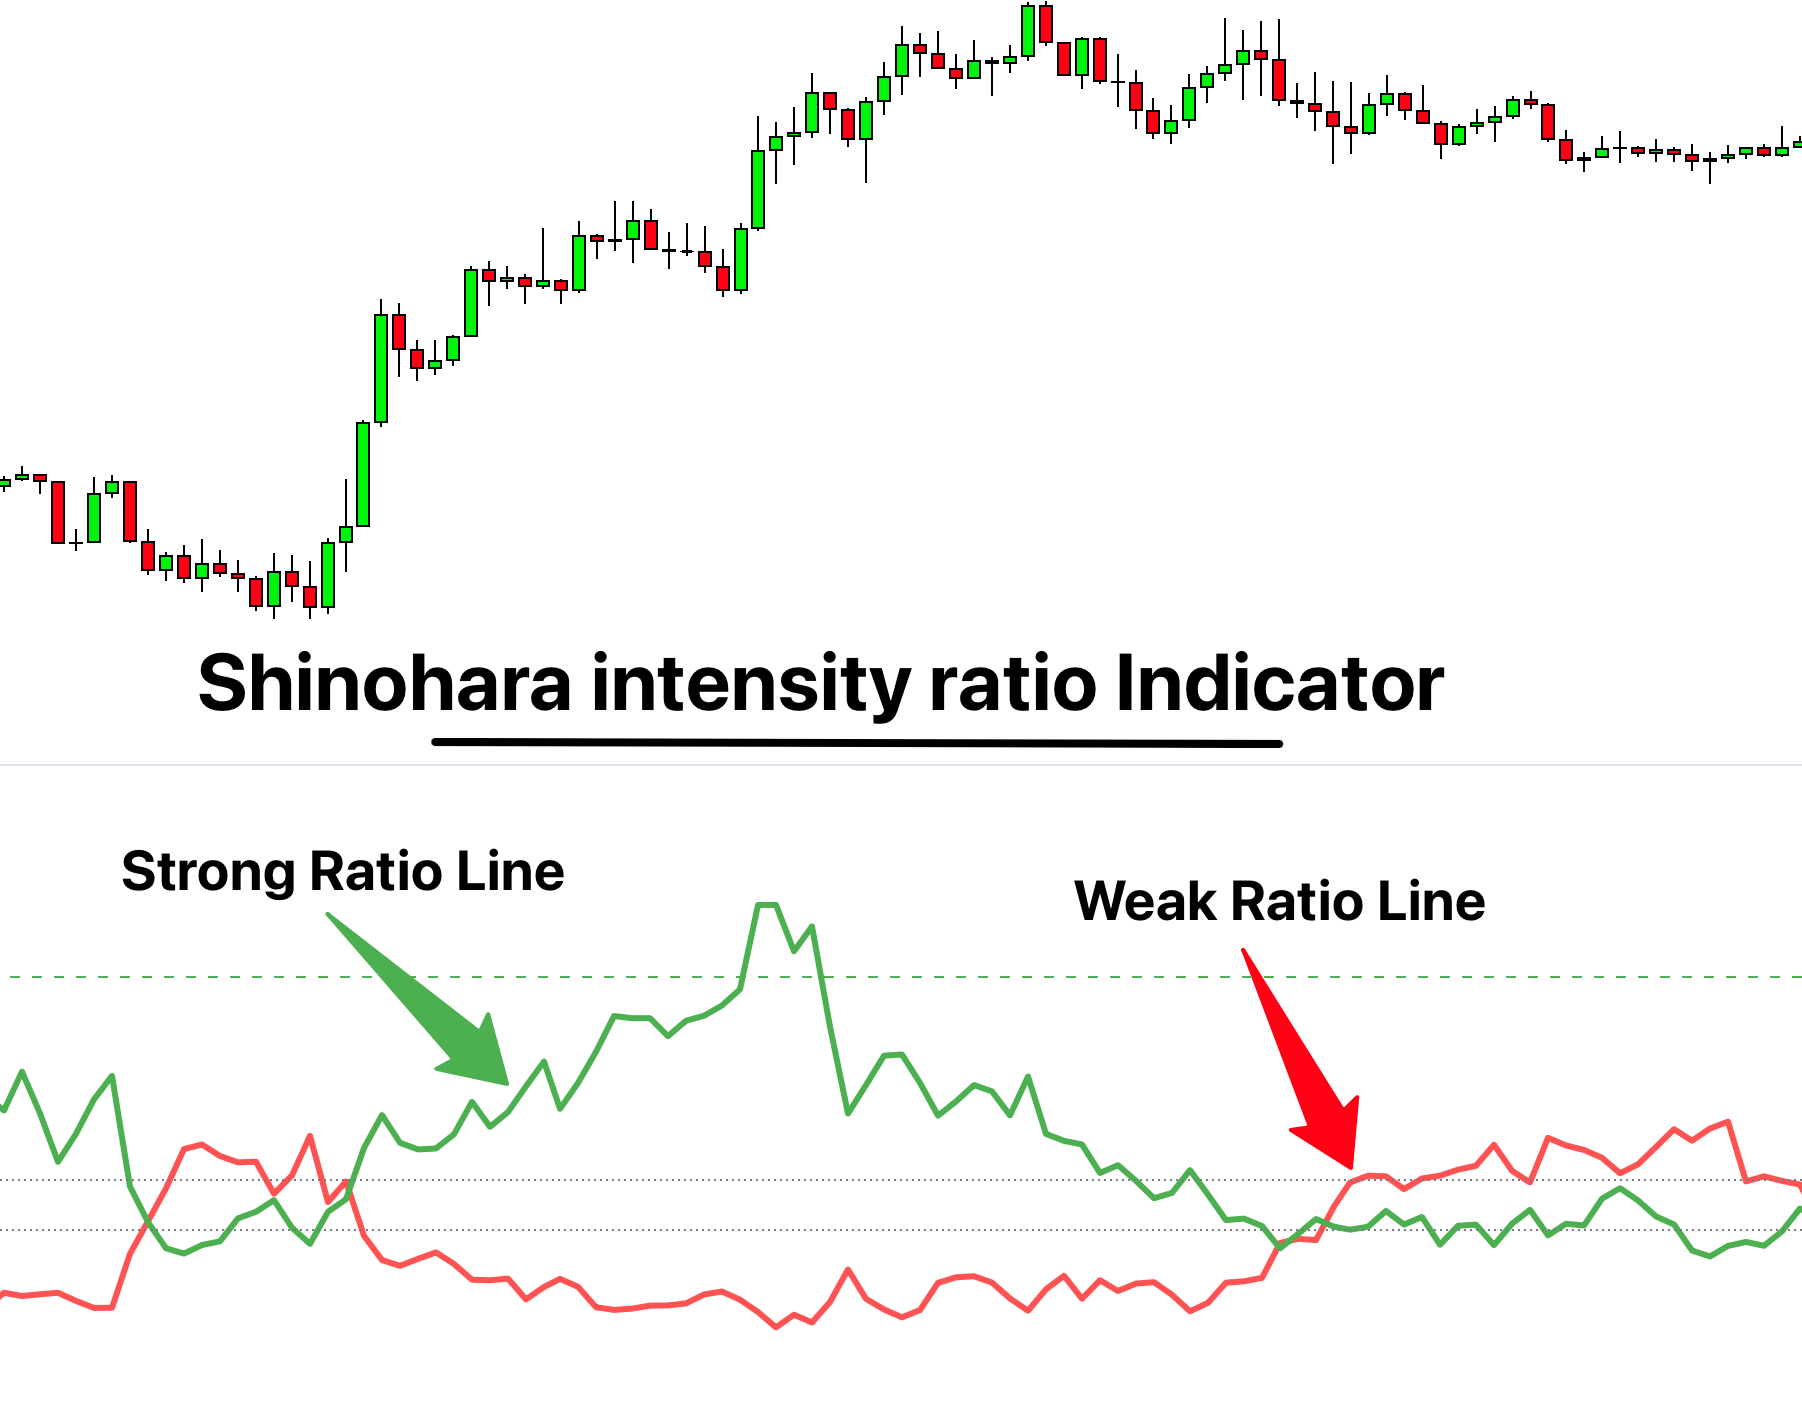
Definition The Shinohara intensity ratio indicator is a trend identification indicator that uses a strong ...
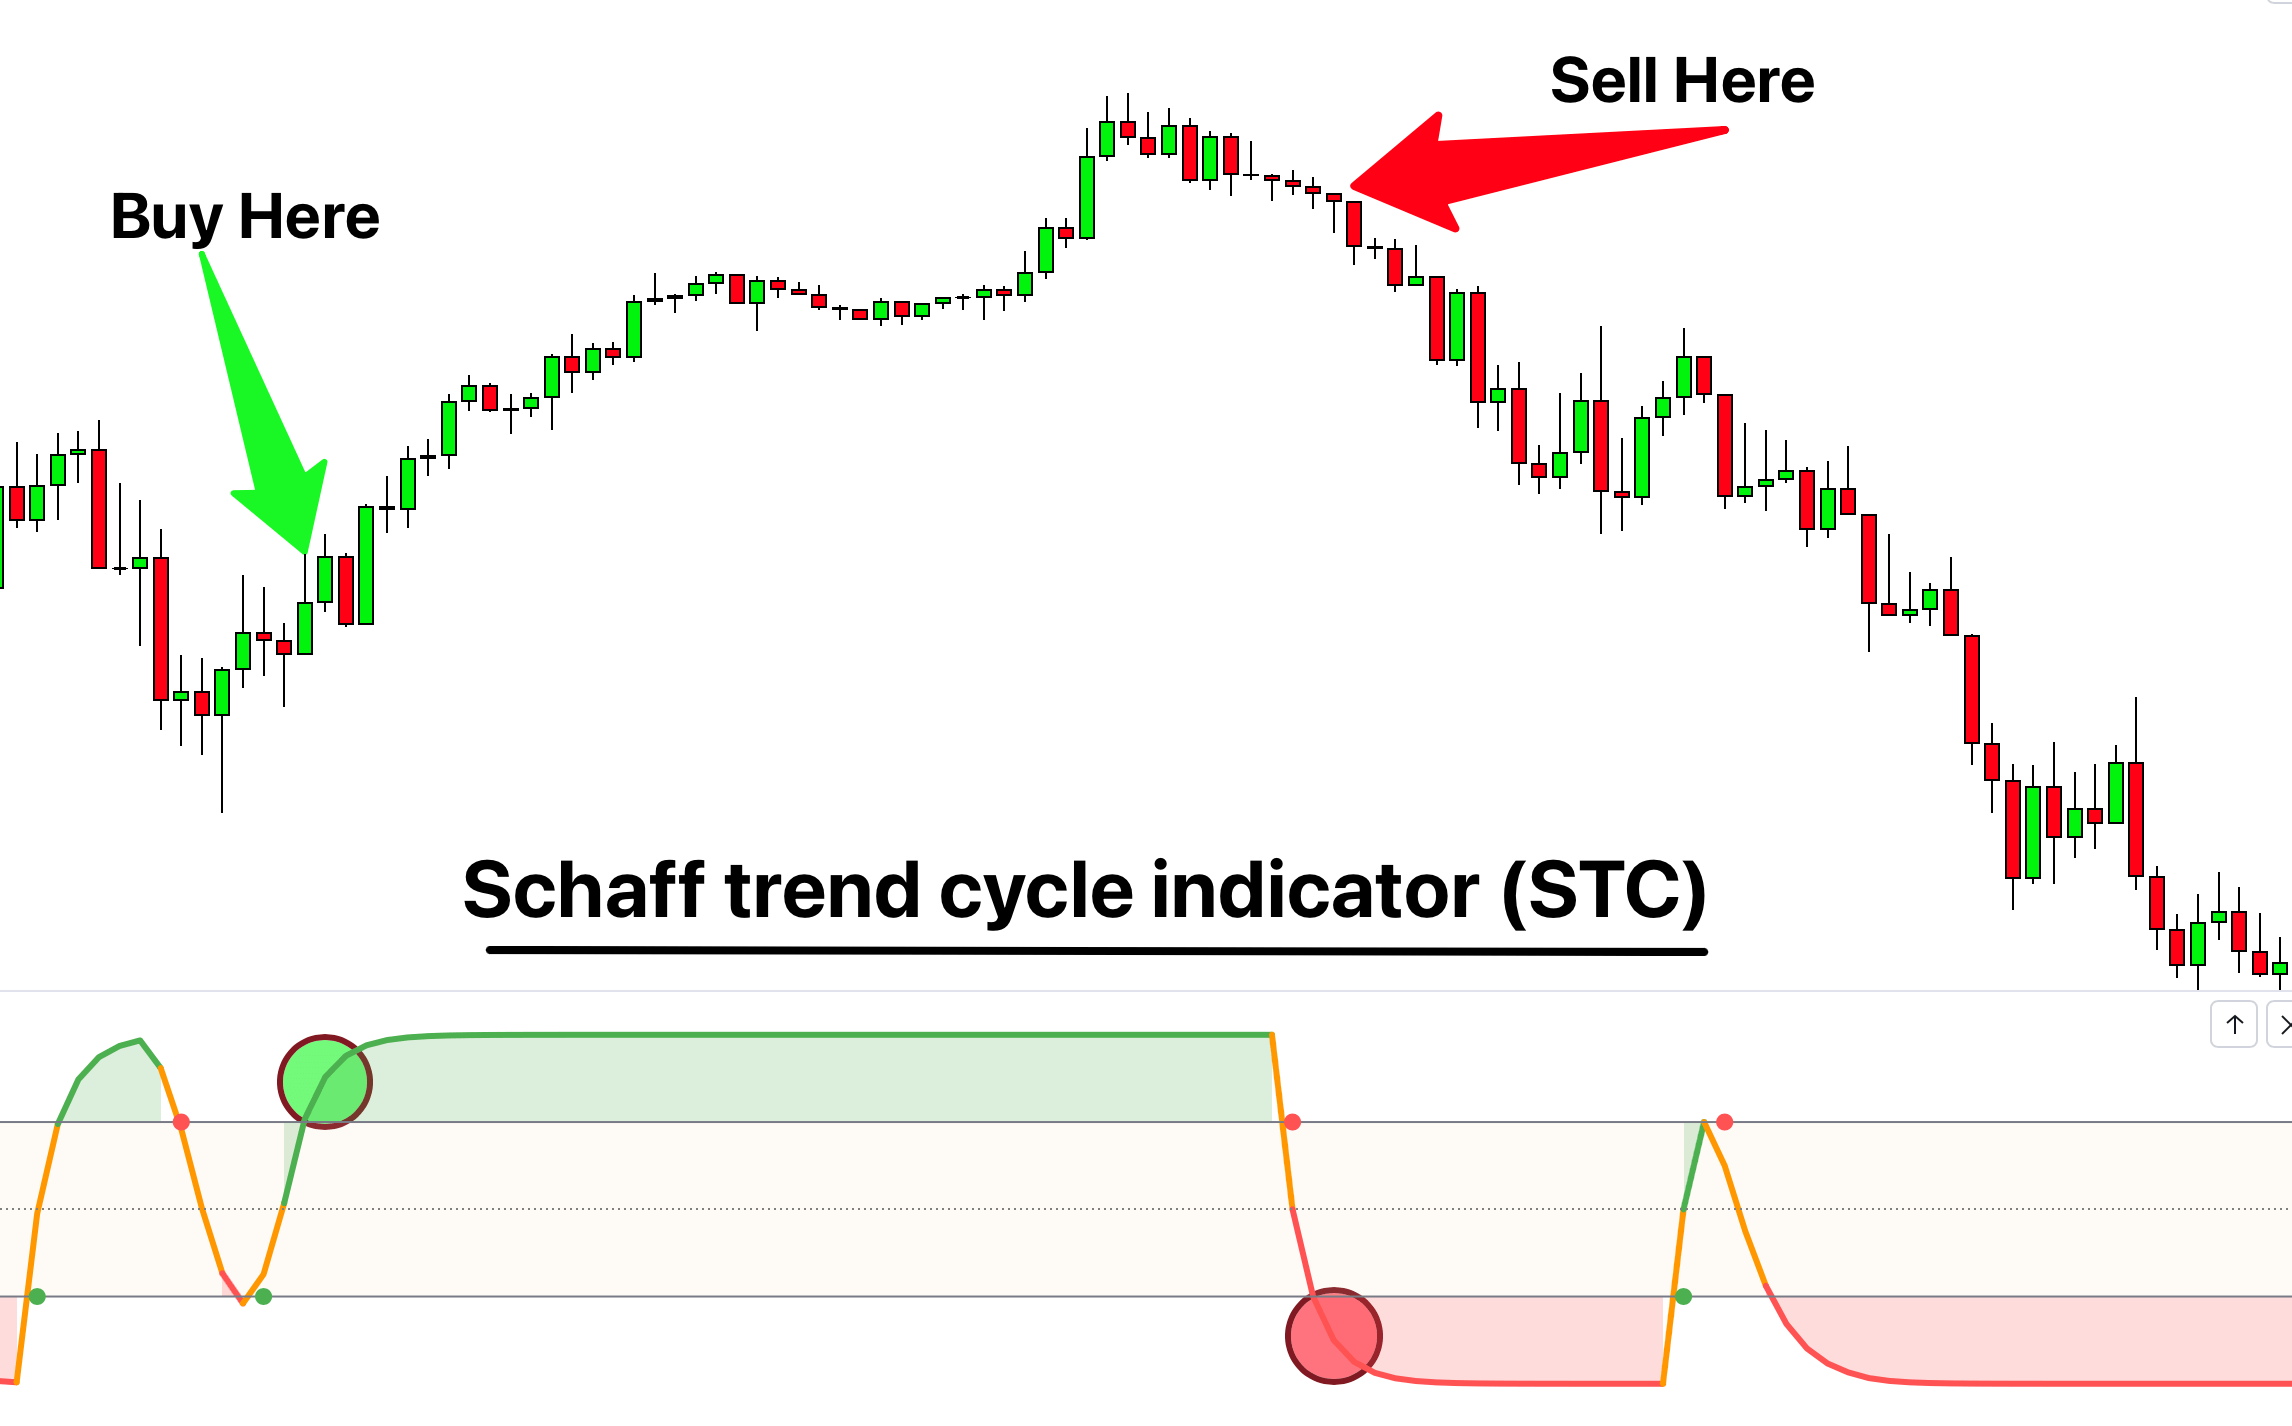
Definition Schaff trend cycle indicator is a technical analysis tool designed to recognize the market ...
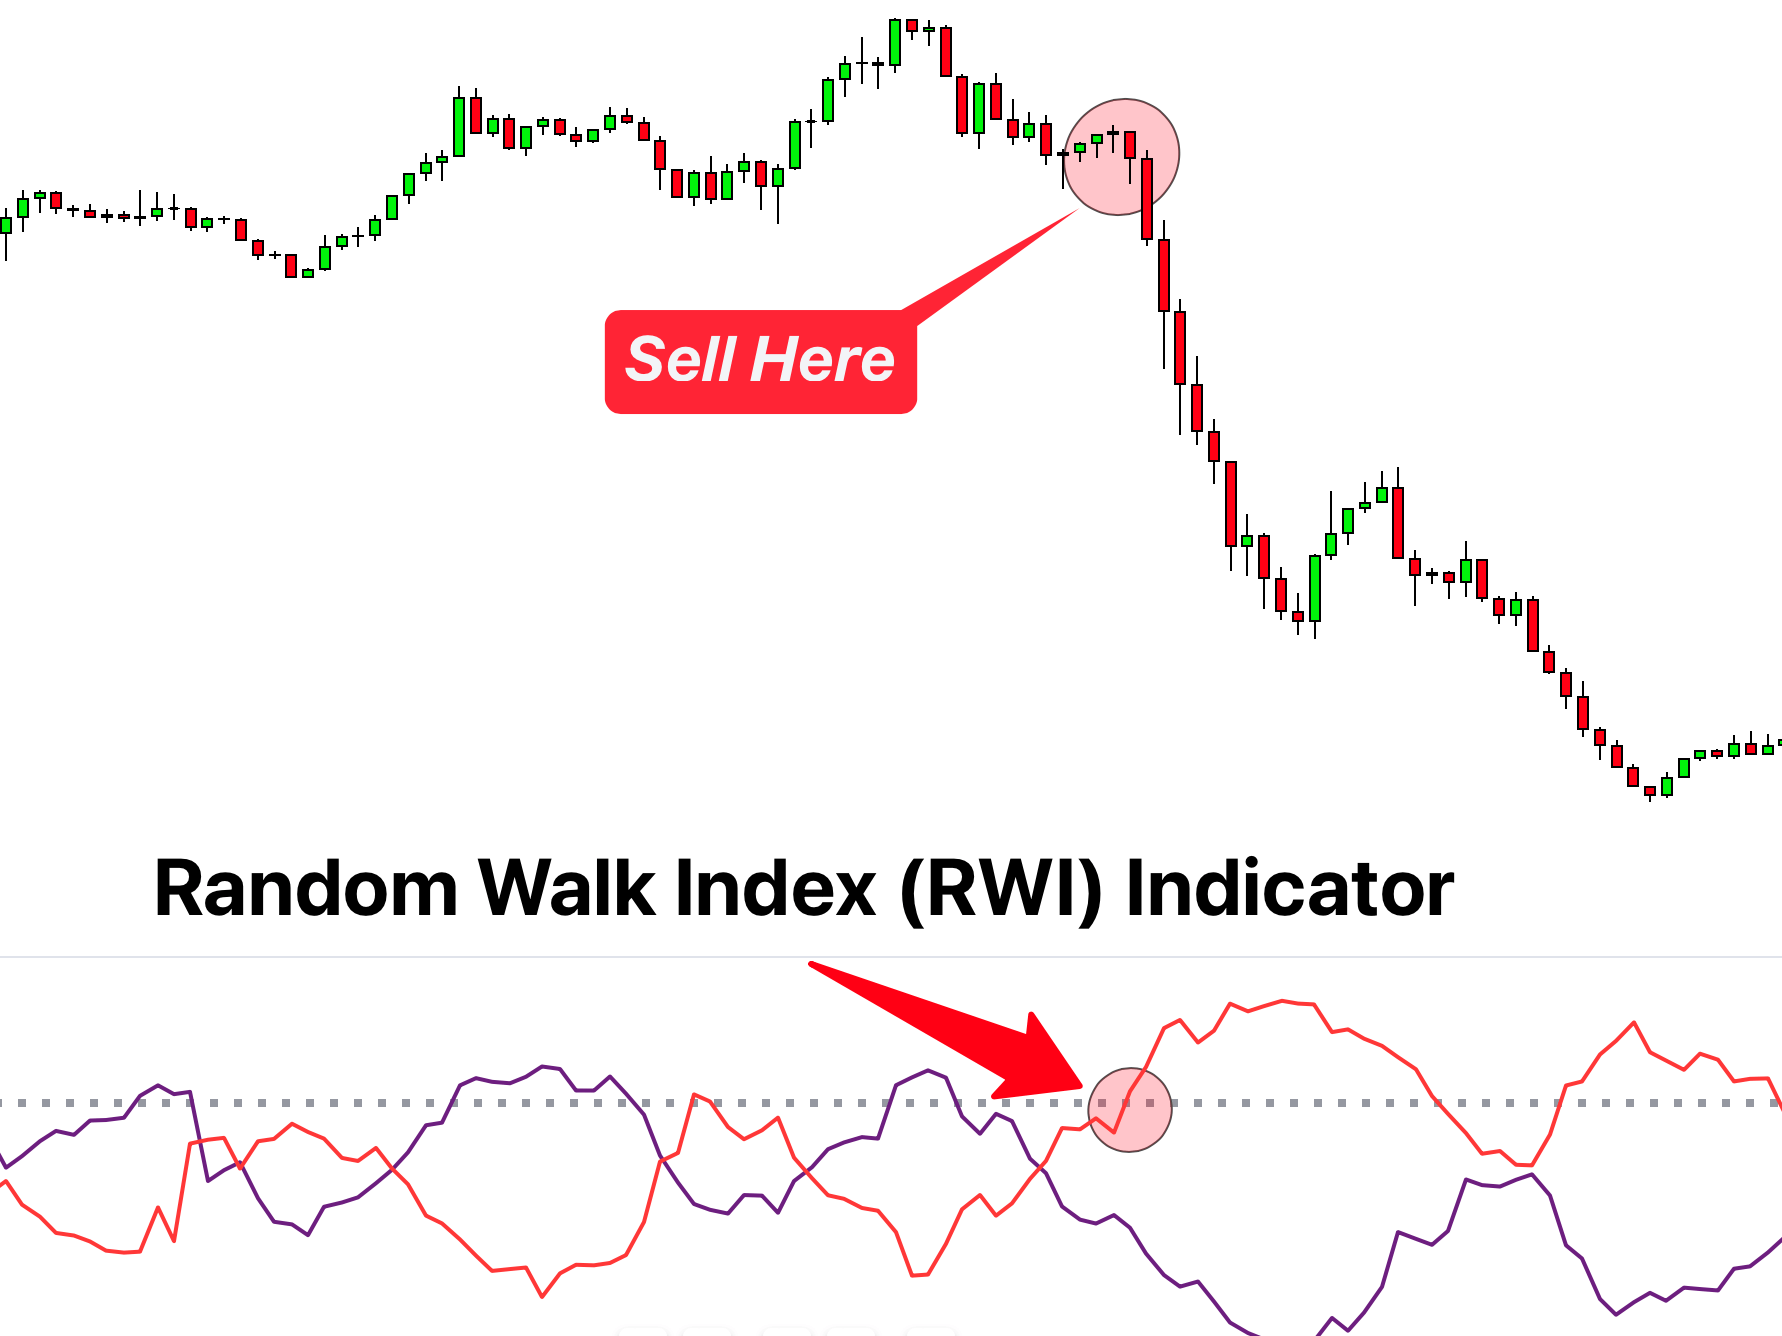
Definition A random walk index indicator is a tool that examines the change in the ...
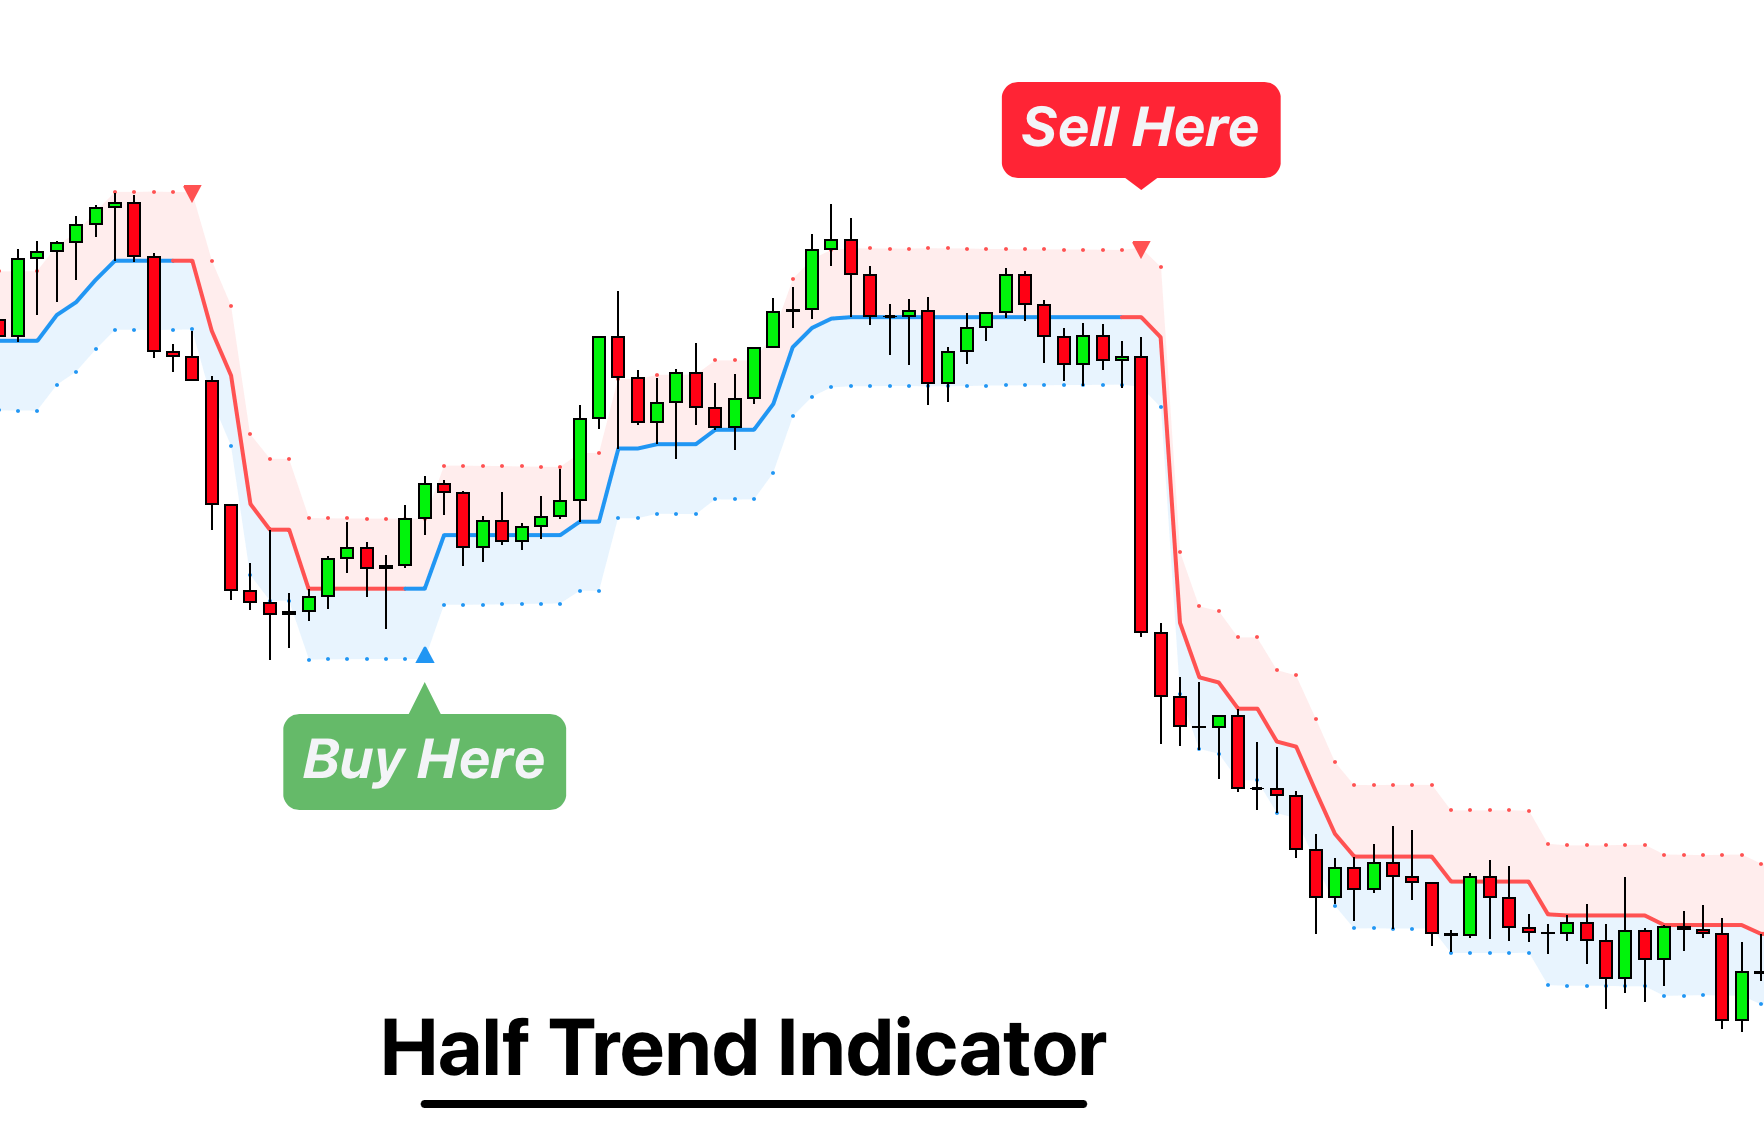
Introduction A half-trend indicator is a technical analysis tool that uses moving averages and price ...
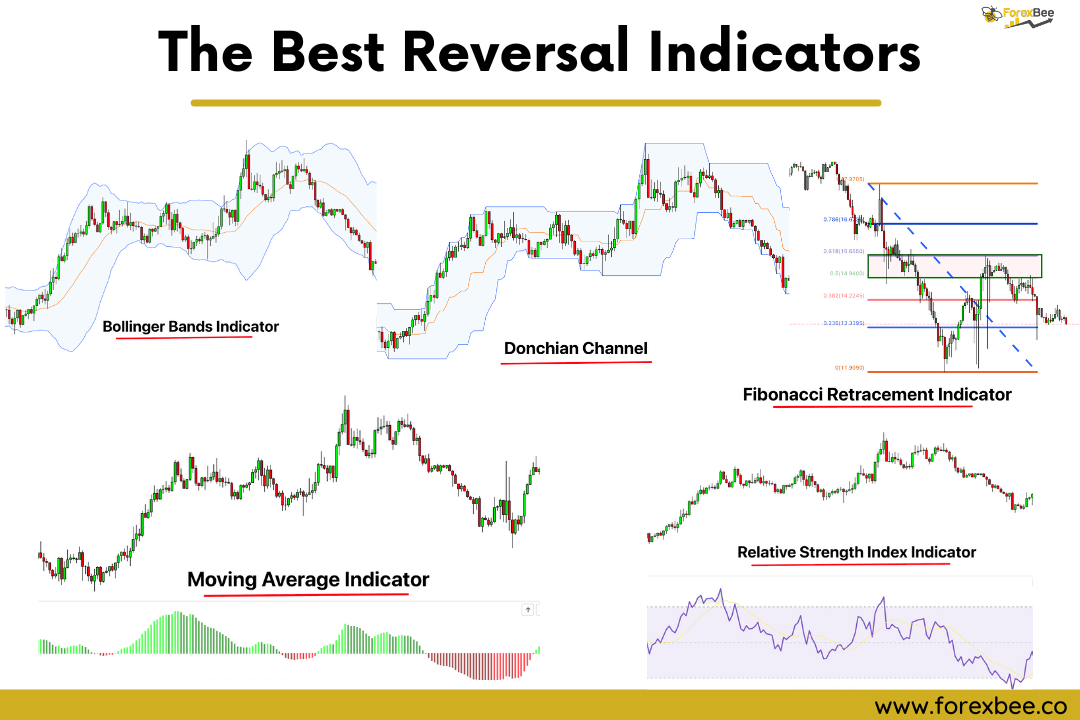
Introduction Reversal indicators are defined as charts, signals, lines, or digits that help a trader ...
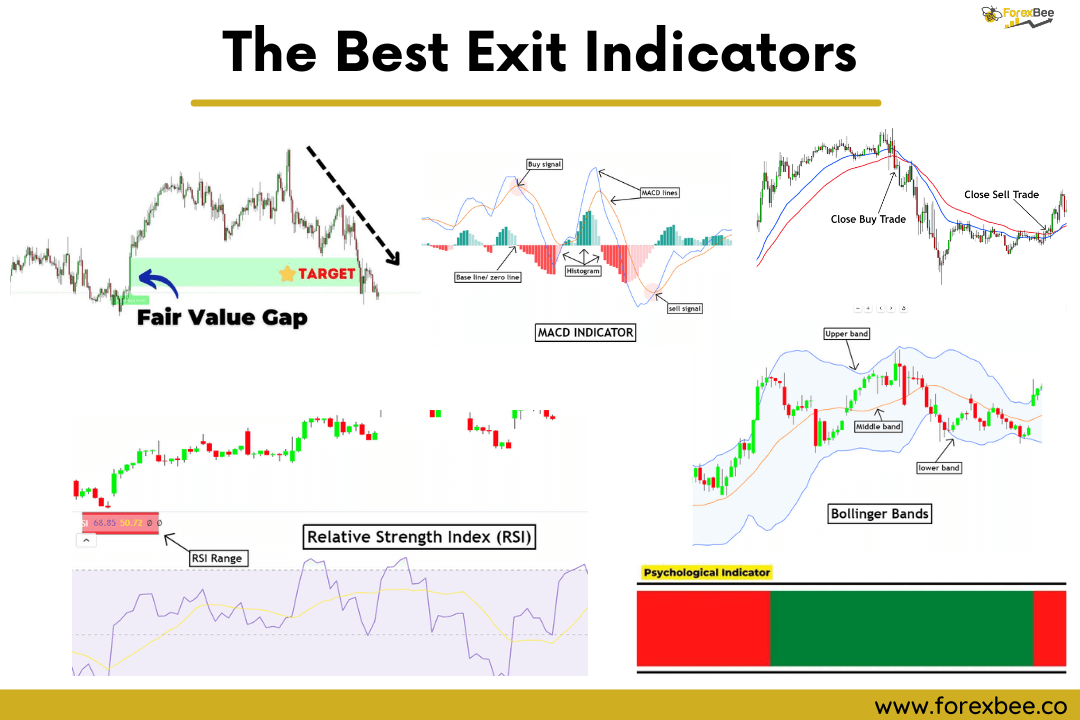
The Best exit indicator is a technical indicator that helps traders to determine the most ...
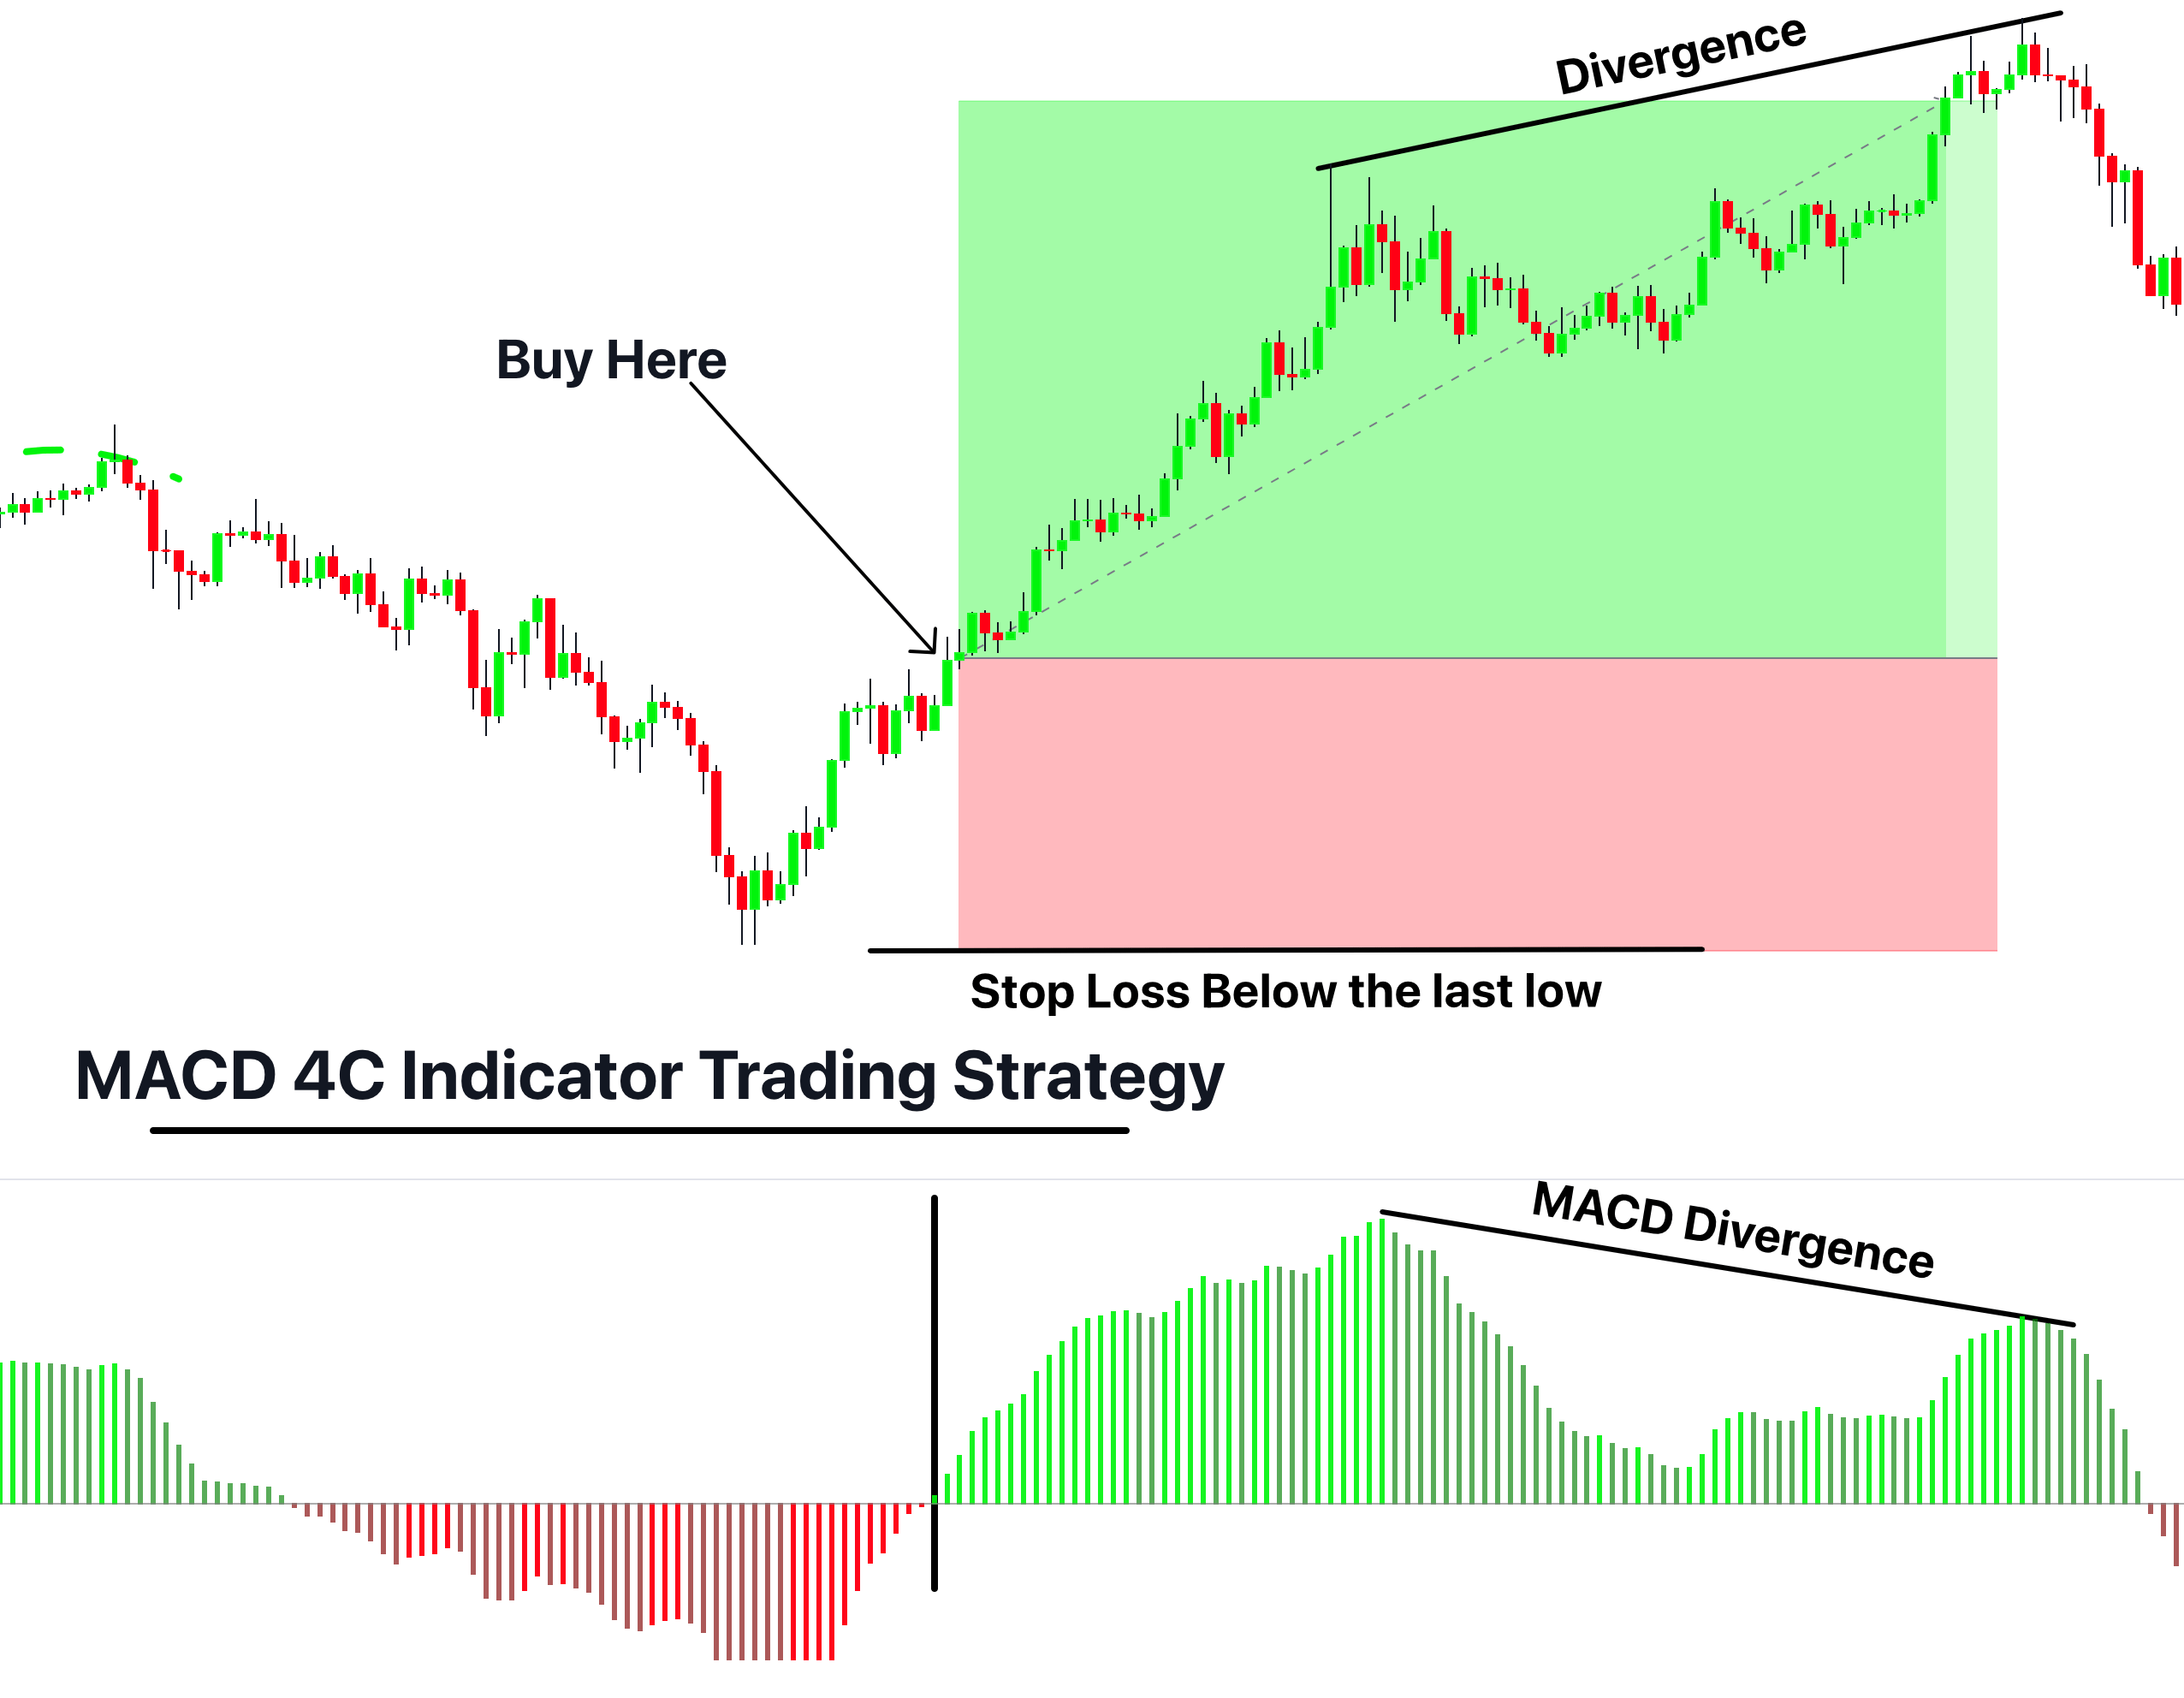
what is MACD 4C indicator? MACD 4C is defined as a modified and derivative indicator ...
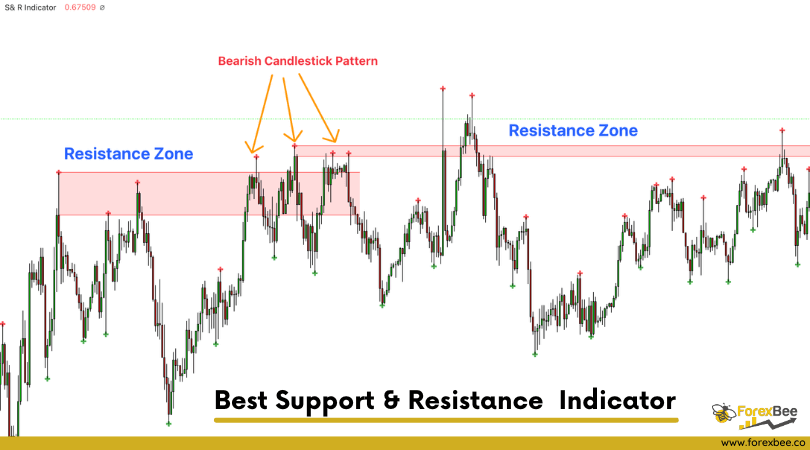
Definition The support and resistance indicator is a technical indicator that will plot the support ...