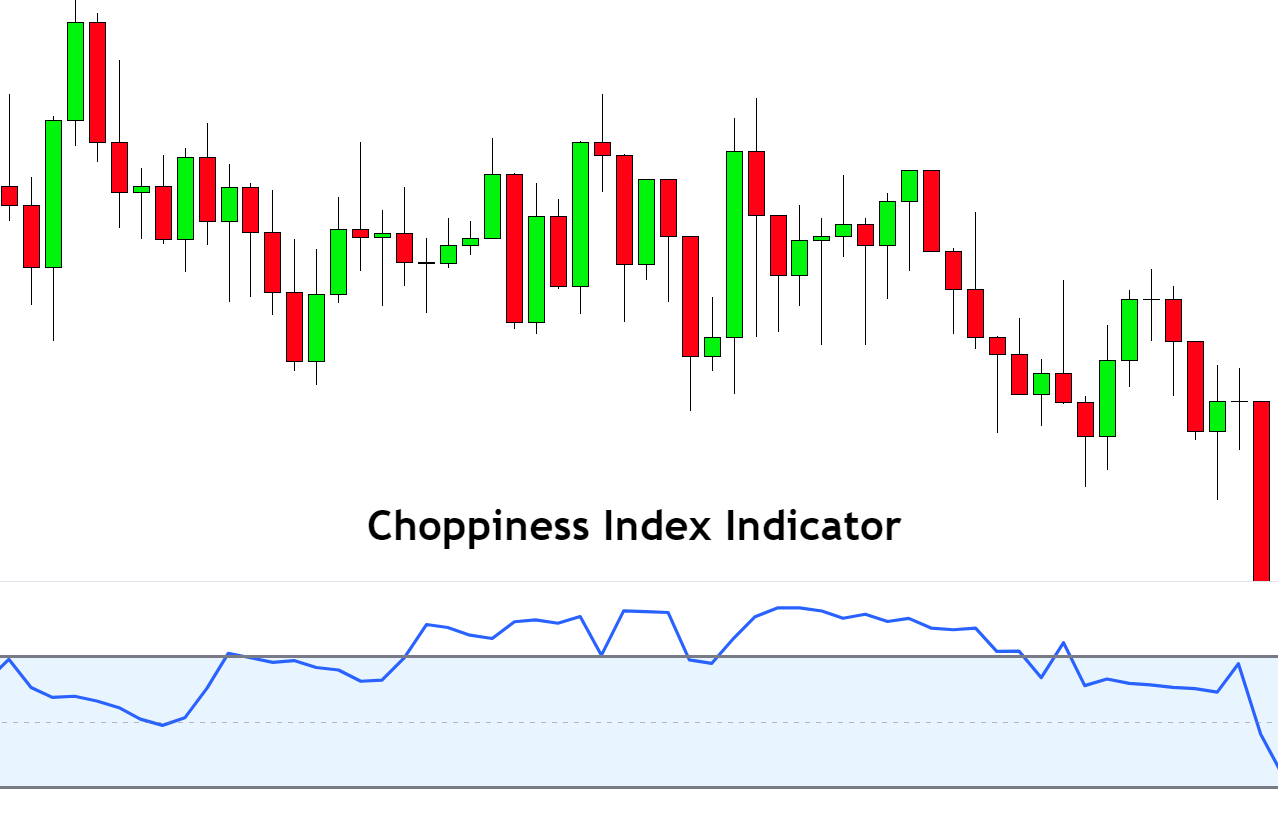
Introduction to Choppiness index indicator The Choppiness index is a technical indicator that finds the ...
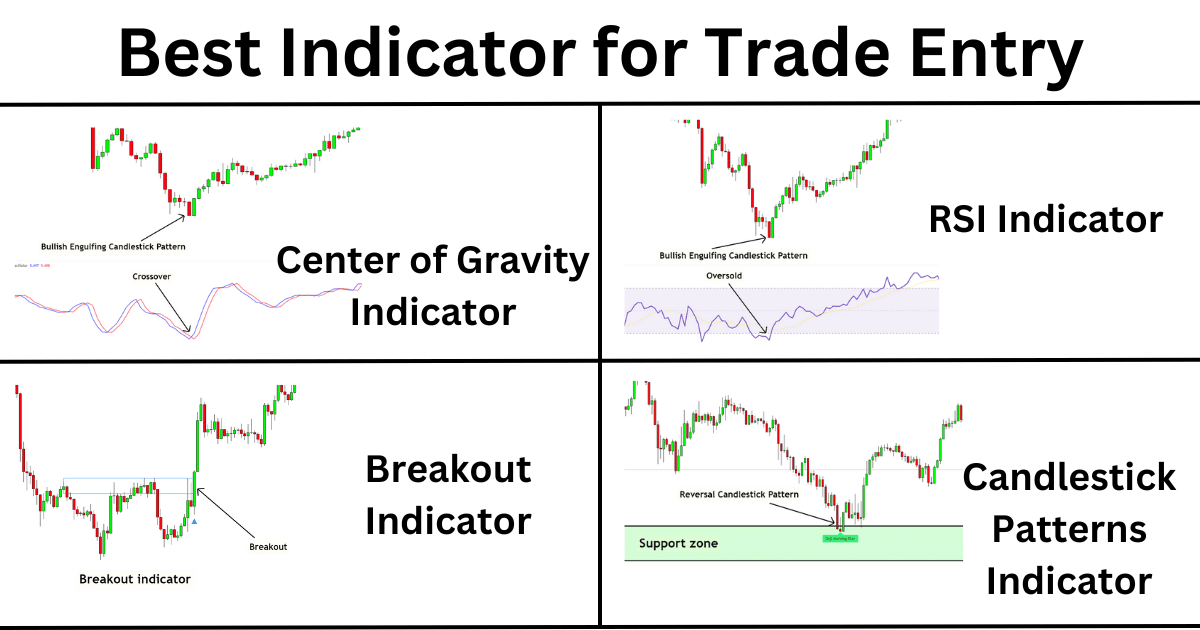
The technical indicators that indicate confirmation before opening a buy or sell order act as ...
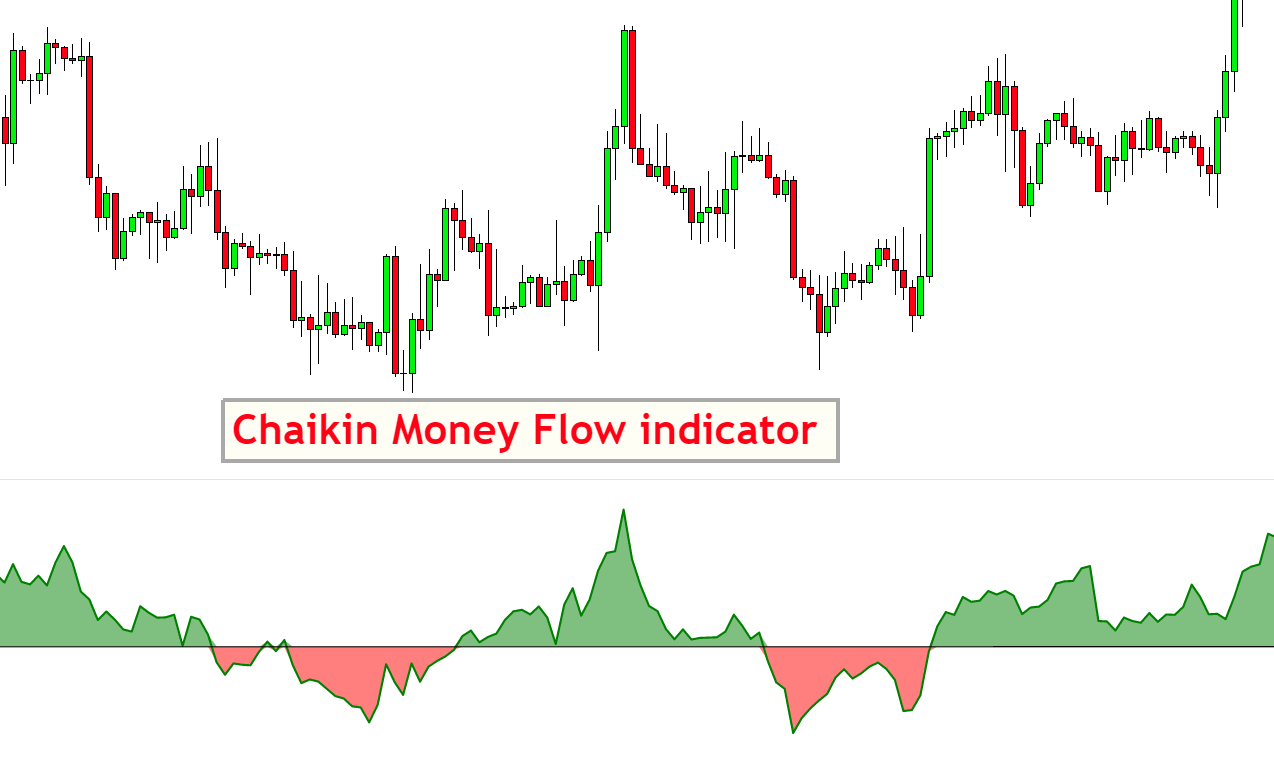
The Chaikin money flow indicator is a technical indicator that shows the accumulation and distribution ...
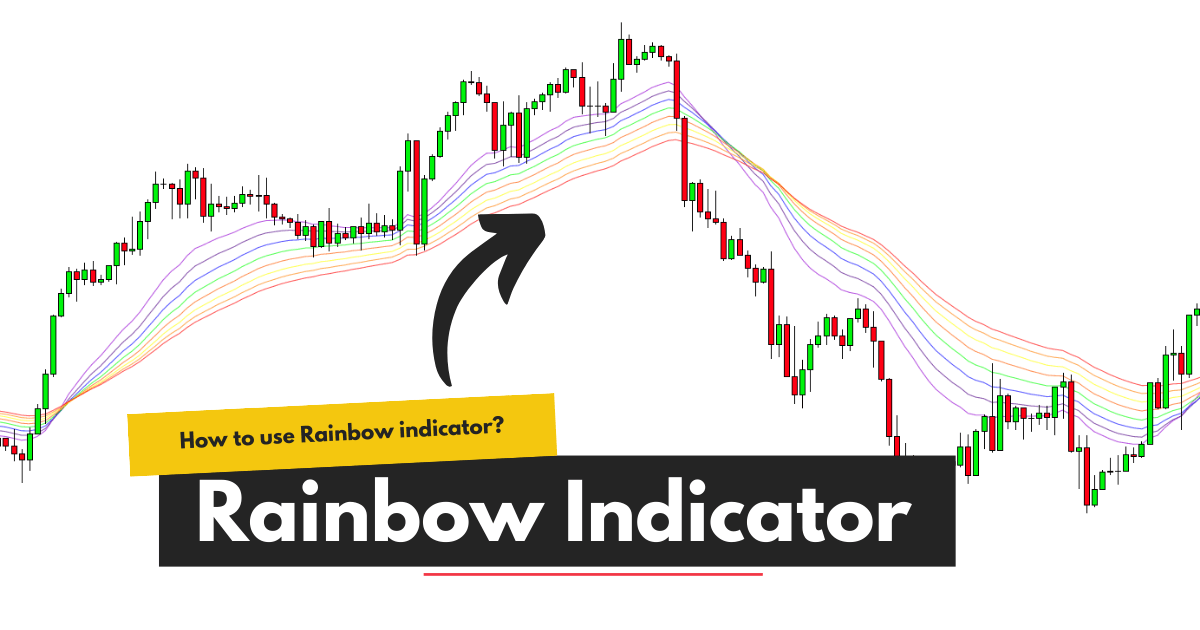
Definition A rainbow indicator is a technical indicator that draws ten simple moving average lines ...
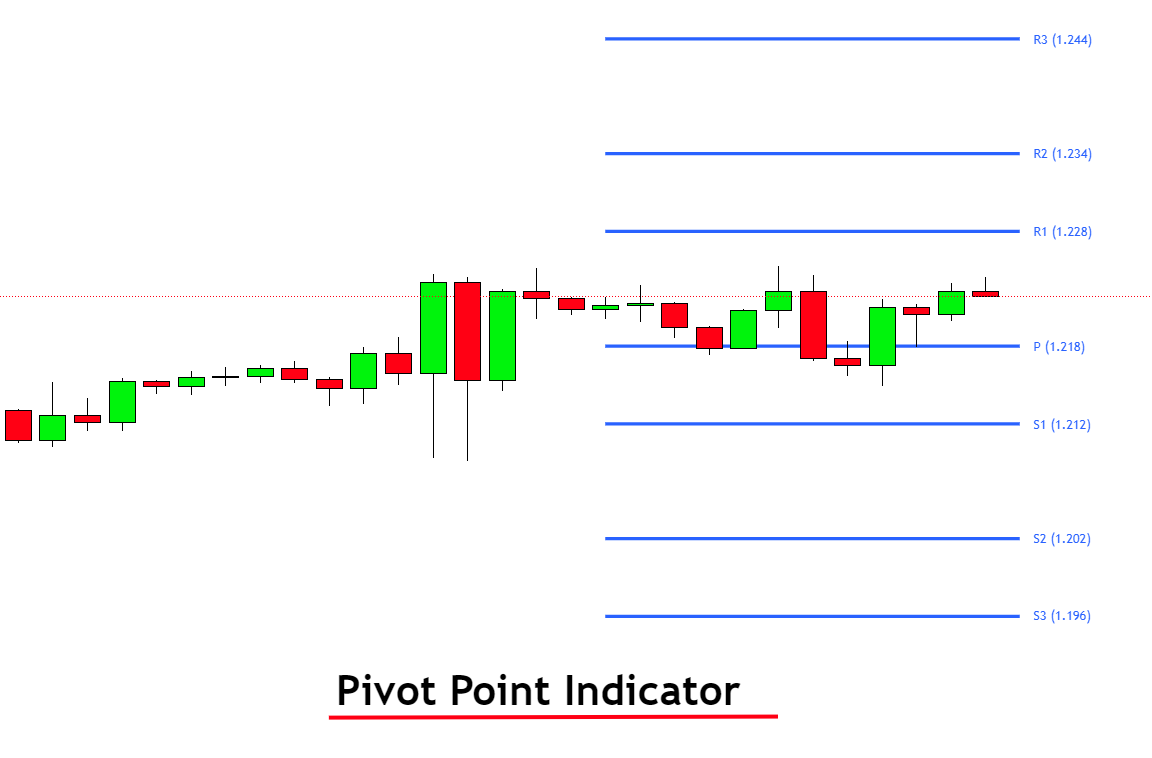
Definition The pivot point indicator is a technical analysis indicator that identifies the support and ...
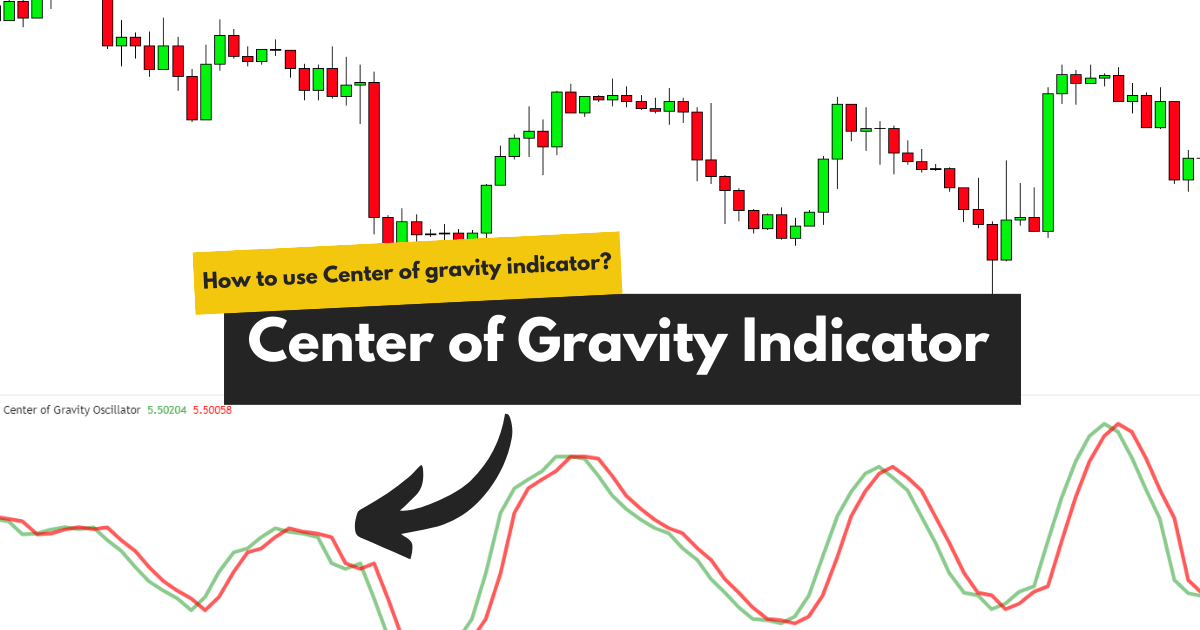
Definition The Center of gravity indicator is a technical indicator that shows the trend reversal ...
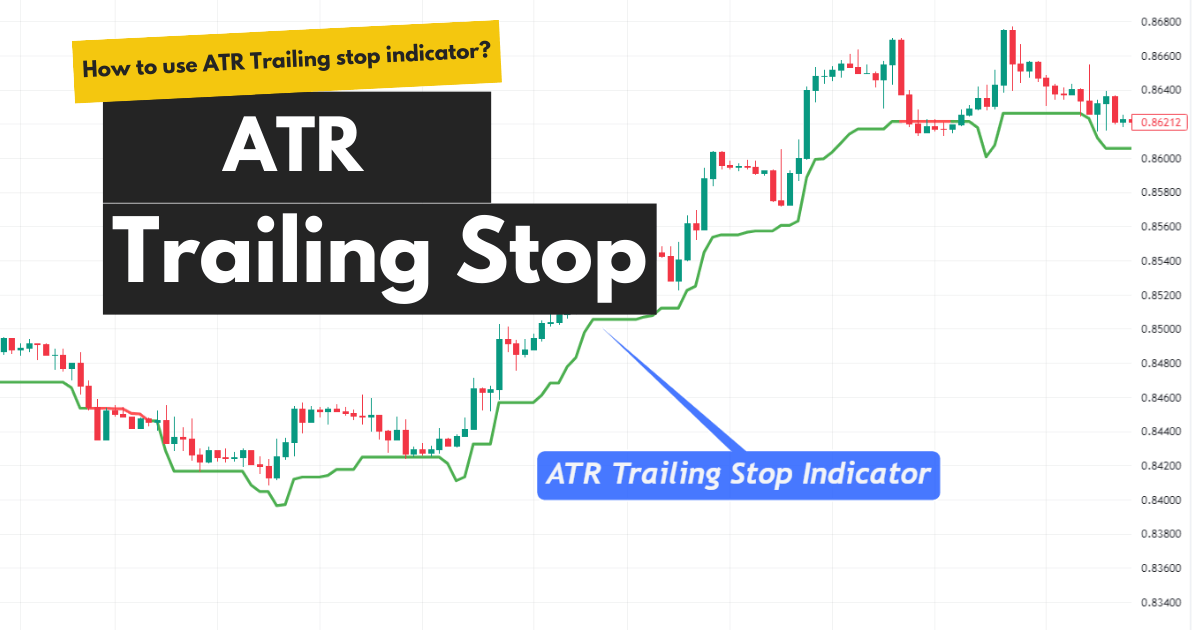
Definition ATR trailing stop is a technical indicator that determines the safe stop-loss levels for ...
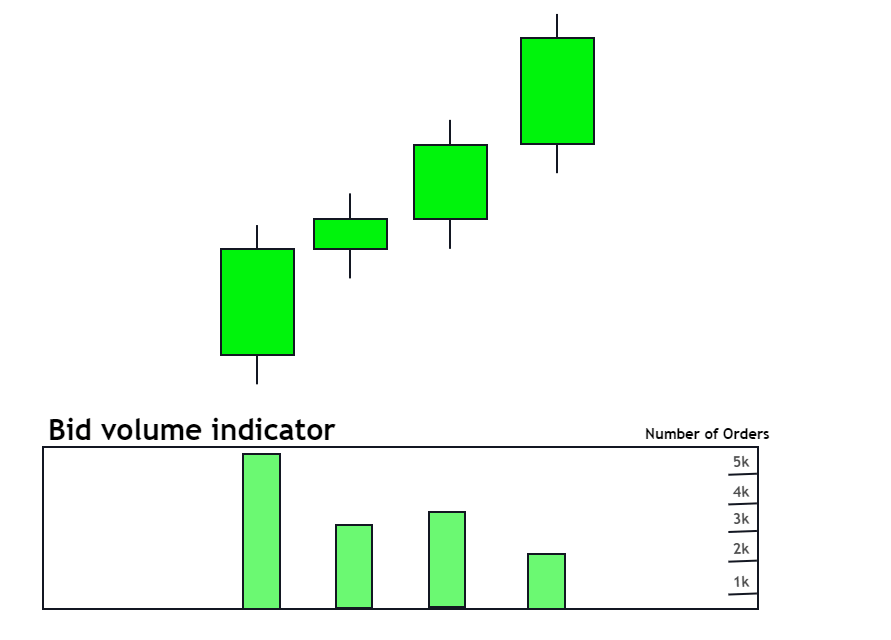
Definition Bid on volume indicator shows the number of orders placed by the traders at ...
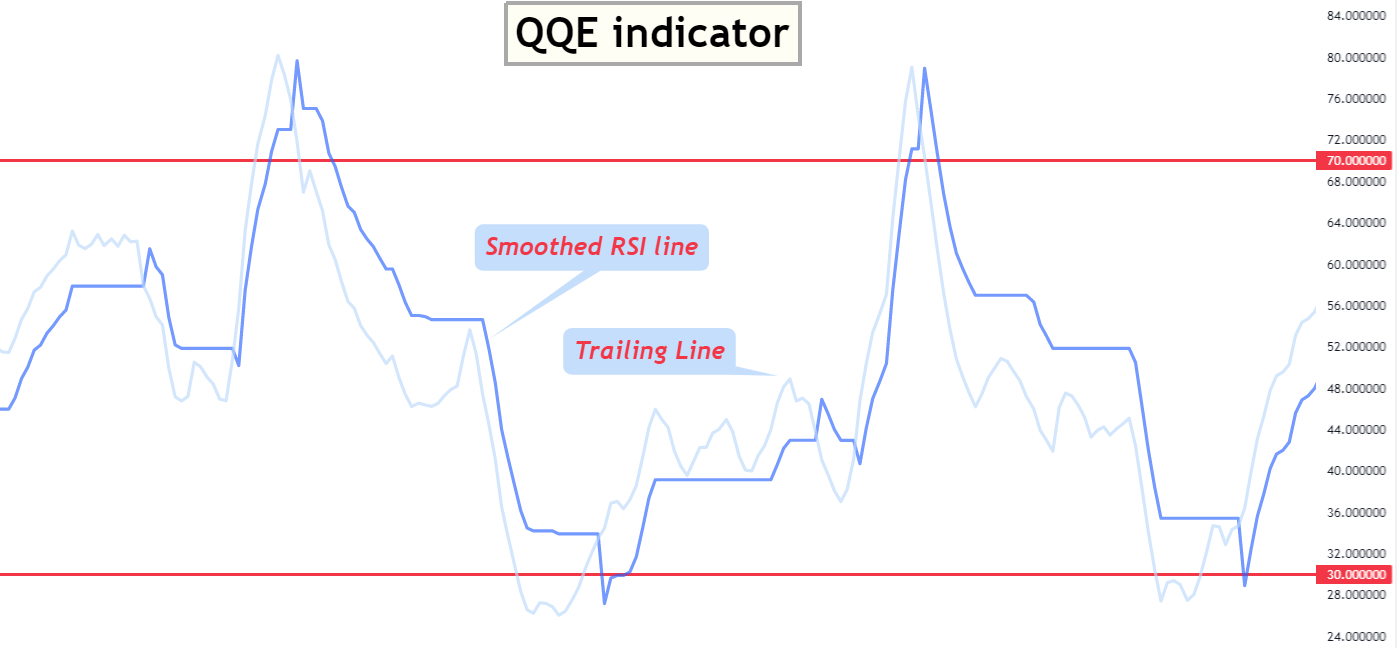
Definition QQE is a technical indicator that identifies the overbought and oversold levels using a ...