
Definition
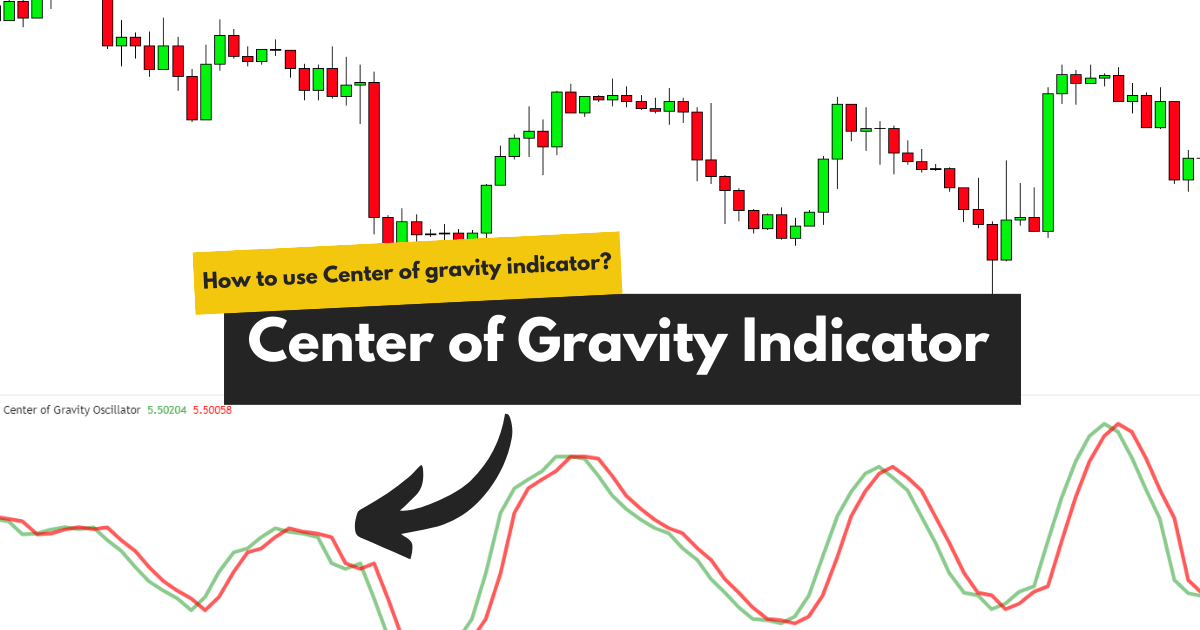
The Center of gravity indicator is a technical indicator that shows the trend reversal in the form of a crossover of the COC line and the signal line. It is a trend reversal indicator, and most traders call it the COC (Center of gravity) indicator.
The indicators are always popular among new and intermediate traders. They use the indicators to forecast the forex market. COC is also one of the most popular technical indicators in the forex market. The creator of this indicator has also claimed that it has no lag in predicting the trend. Most of the indicators lag behind the price, so it isn’t easy to accurately forecast using technical indicators.
I will explain the Center of gravity indicator in detail in this post, so read the full article.
Formula
The Center of gravity indicator is made of the following formula
COC formula = Sum of candlestick closing prices (n+1)/Sum of candlestick closing prices
The signal line in the indicator is the simple moving average line.
Best settings for Center of gravity indicator
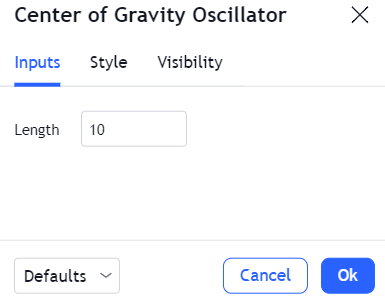
The period over which the Center of gravity indicator calculates the closing prices of candlesticks is ten. It calculates the closing price of the last 10 candlesticks and then adds those prices to the above provided formula to generate the COC line.
You can also adjust the period according to the type of trading strategy. However, the optimum period for the COC indicator is 10, and the creator of this indicator also recommends it.
Working
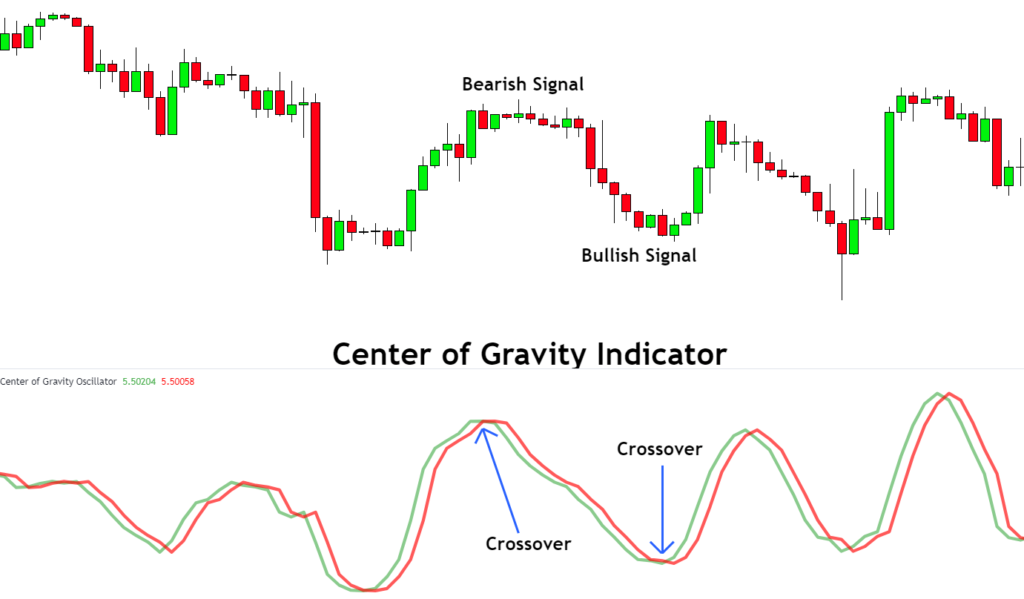
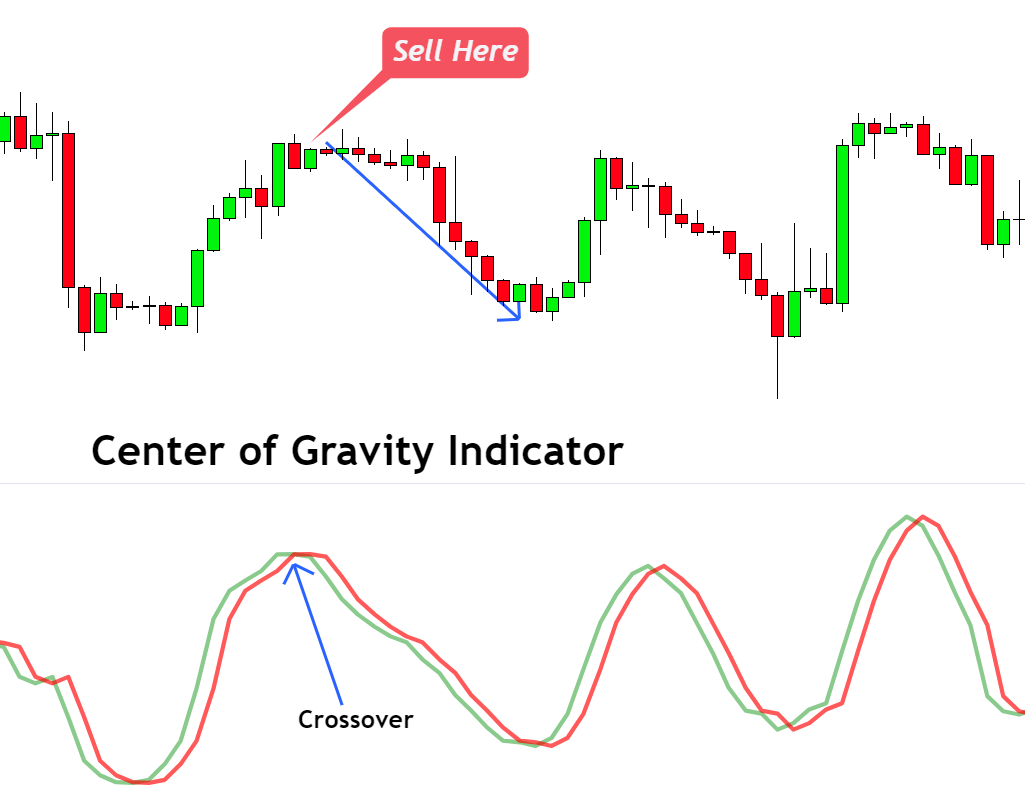
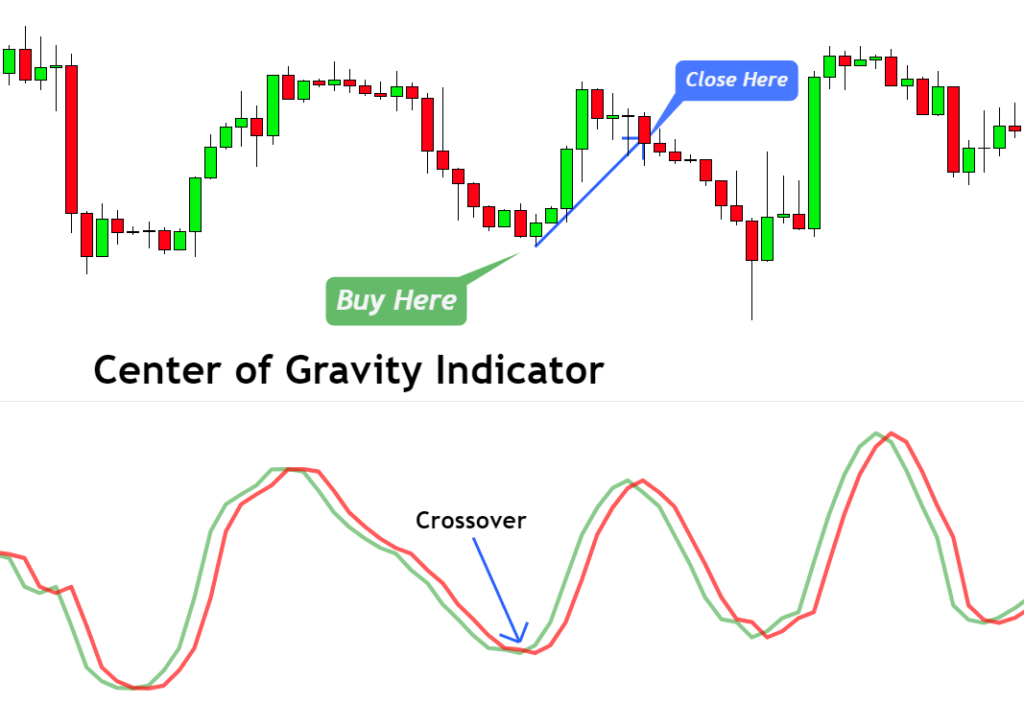
In the Center of gravity indicator, there are two red and green lines. The green line acts as a COC line, while the red line represents the signal line.
Bearish signal
When the green line crosses the red line from the upper side, the indicator generates a sell signal or forecasts a bearish trend.
Bullish signal
When the green line crosses the red line from the lower side, the indicator generates a buy signal.
How to trade with the Center of gravity indicator?
There are two methods to trade using the Center of gravity indicator
- Use crossover to open buy or sell trades
- Use the crossover to determine the support and resistance levels
Find the pivot points or support resistance levels
You can also determine the major support and resistance levels on the chart using the Center of gravity indicator. I will also recommend you use this indicator in a price action way, like finding support resistance levels, instead of using it for opening and closing trades. If you rely entirely on the COC indicator, your winning ratio will be less than 50%. You always need to add more confluences to increase the winning ratio.
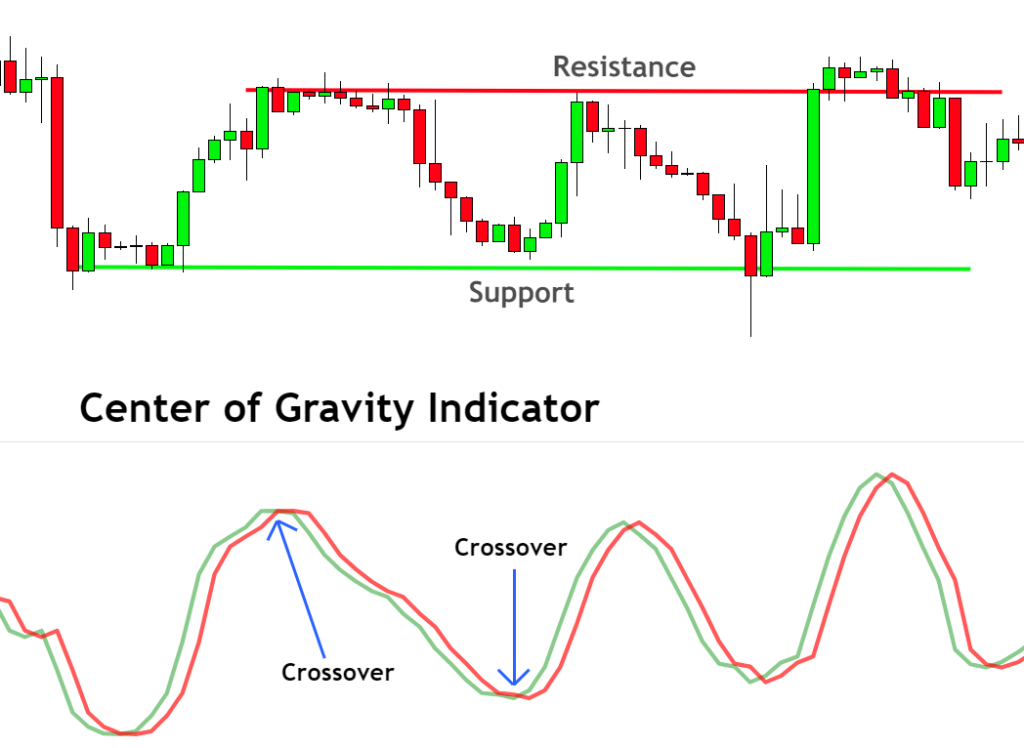
According to the Center of gravity indicator, when the market takes a big trend reversal, it means there’s a strong key level at that price level. Trend reversal occurs when the COC line and signal line crossover occur.
So, according to these rules, a bullish trend reversal occurs when the green line crosses the red line from the lower side. Then at that price level, you can draw a support zone.
On the other hand, when the green line crosses the red line from the upper side, a bearish trend reversal occurs. Then at that price level, you can draw a resistance zone.
The probability of winning this indicator is high during the ranging market conditions.
Find the trend reversal points for buying and selling
This method includes simple buying and selling based on the COC line and signal line crossover.
When the indicator creates a bullish signal, open the sell order and close the trade on the opposite reversal signal. In the same way, when an indicator makes a bearish signal, then open sell trade.
However, I will not recommend you to keep trading this simply because a simple mathematical formula cannot make you a profitable trader. You need to add confluences to build a profitable trading system.
The bottom line
The Center of gravity indicator is a custom indicator in MetaTrader and tradingview platforms. However, in specific trading platforms, it is a built-in indicator.
I highly recommend you to use it to determine the support and resistance levels. If you still want to use it in trading, trade it with the confluence of candlestick patterns and ATR trailing stop indicator.