
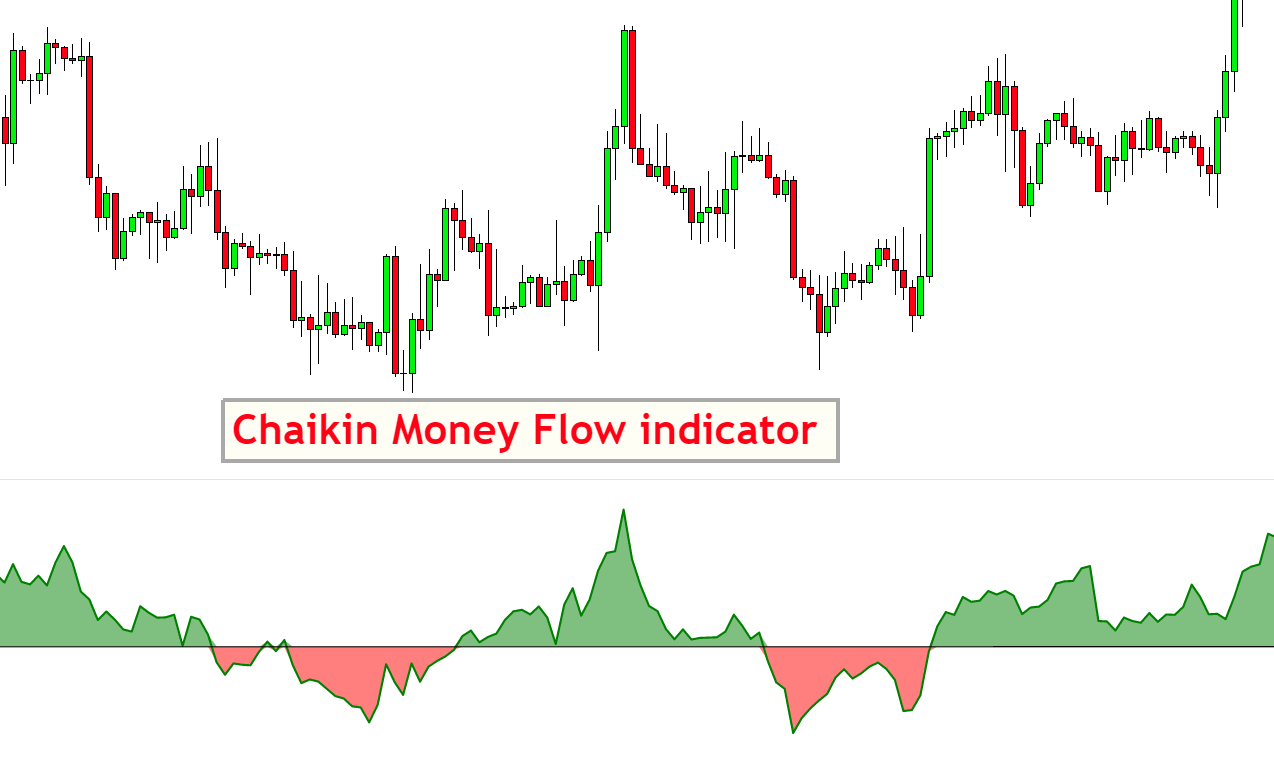
The Chaikin money flow indicator is a technical indicator that shows the accumulation and distribution on the chart using the OHLC values and volume over a specific time interval. It is denoted by the CMF indicator.
Accumulation and distribution is the most basic concept of trading in the market. However, it’s not easy to find the accumulation and distribution areas of the candlestick chart. And. The Chaikin money flow indicator makes it easy for retail traders to find the price areas at which the accumulation or distribution occurs. Then retail traders forecast the market based on this basic concept.
In this post, I will explain the Chaikin money flow indicator completely with a trading strategy. So make sure to read it to the end.

Formula
Chaikin money flow is the ratio of average money flow over a specific period to the average volume over that specific period.
CMF formula = N period average of money flow / N period average of volume
Here the N is the number of periods, usually 21.
The formula to calculate the money flow is:
Money flow = (C – L) – (H – C)/(H – L)
Here
C = closing price of the candlestick
L = Low price of the candlestick
H = High price of the candlestick
Best settings for the Chaikin money flow indicator
The Chaikin money flow indicator contains only a period as input. The best optimum value of the period is 21. It is because there are 21 trading days in a month. For a daily timeframe, 21 periods is the perfect value. However, you can also backtest using other period values on lower timeframes.
| Function | Value |
|---|---|
| Period for Chaikin money flow indicator | 21 |
Working of Chaikin money flow indicator
The working principle of the CMF indicator is elementary and straightforward. When you add this indicator to the chart, it will open in a separate window with three lines of value 1,0 and -1. 1 and -1 are peak values, and the 0 line is the mean value. The Chaikin money flow line continuously oscillates between 1 and -1, that’s why it acts as an oscillator.
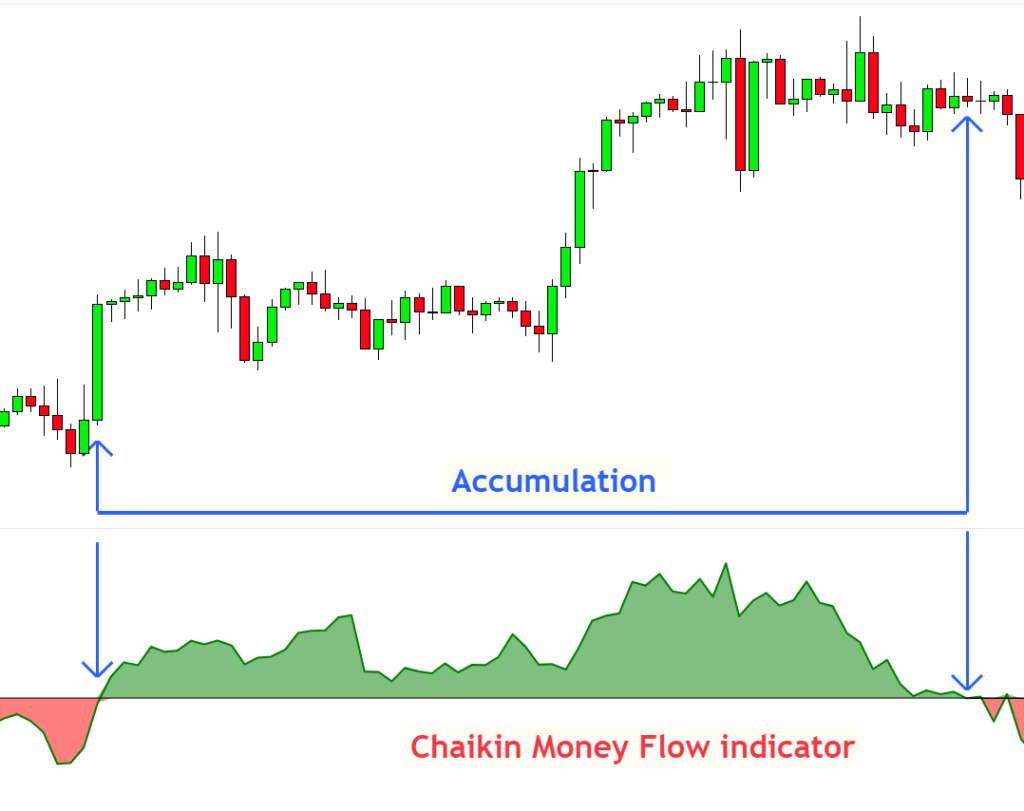
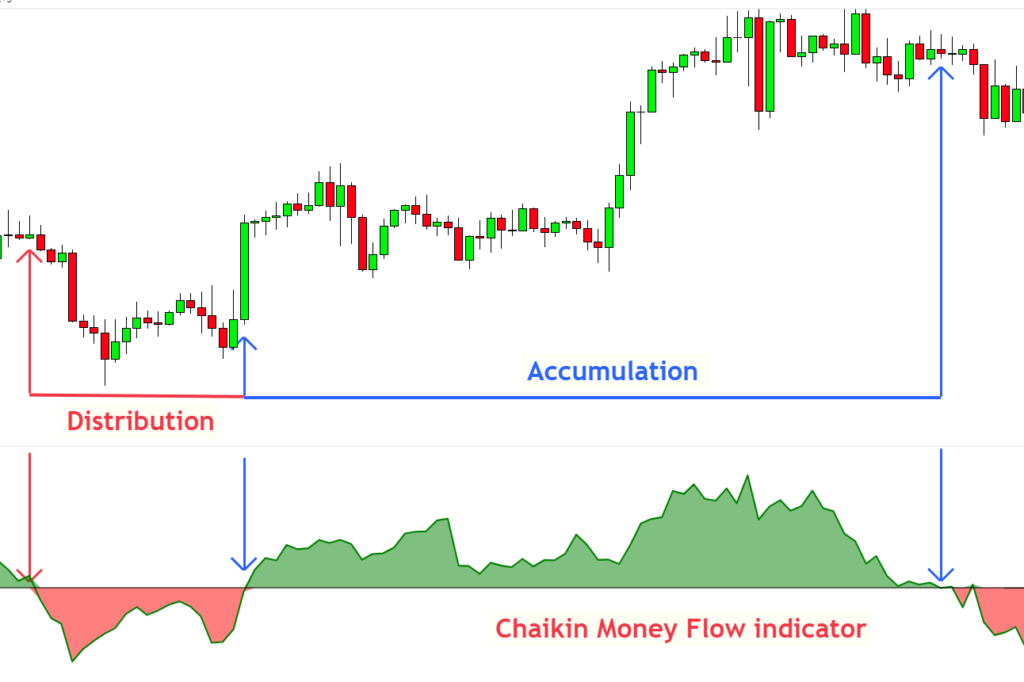
Accumulation
When the CMF line crosses above the zero line, it shows that accumulation is taking place in the financial asset. The more the CMP line is above the zero line, the more accumulation occurs, representing a strong bullish signal.
Distribution
When the CMP line crosses below the zero line, it represents that the distribution is taking place in the financial asset. The more the CMF line is below the zero line, the more distribution occurs. So it’s bearish or sell signal.
Importance
Now you’re familiar with the CMF indicator, and it’s working. The next important thing is to learn its usage and trading strategy.
This indicator is used to determine the following
- Trend direction
- Support or resistance breakout
- Divergence trading
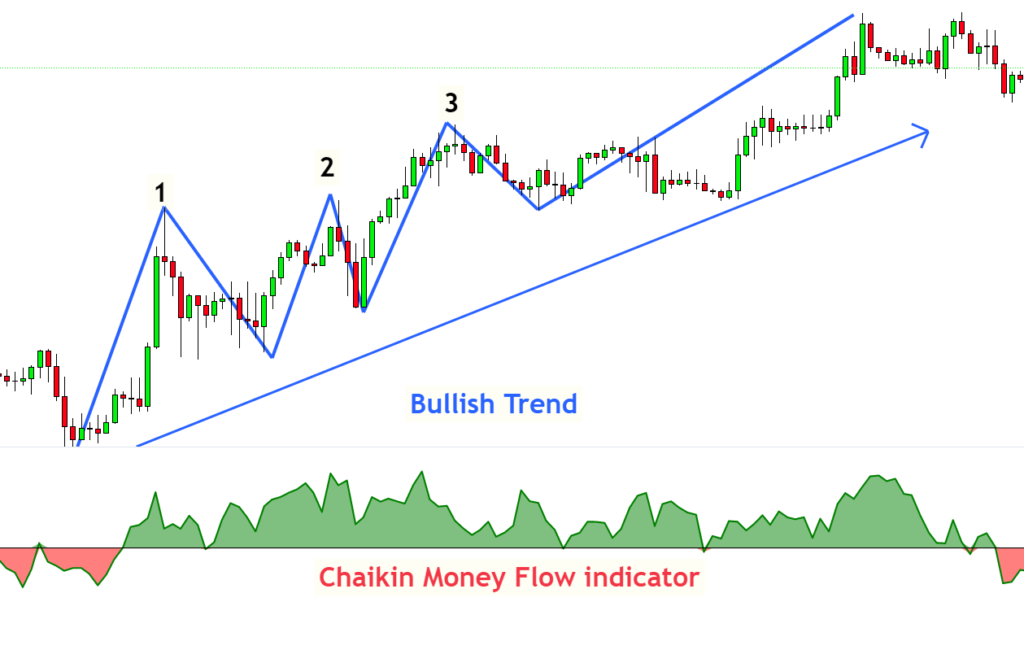
Trend direction
The Chaikin oscillator moves between 1 and -1. It’s easy to find the trend direction using this indicator.
- When the price stays above the zero line for two to three price swing waves, it indicates a bullish trend.
- On the other hand, if the price stays below the zero line for two of these swing waves, it is a bearish trend signal.
So by following the above two rules, you can easily find the trend direction.
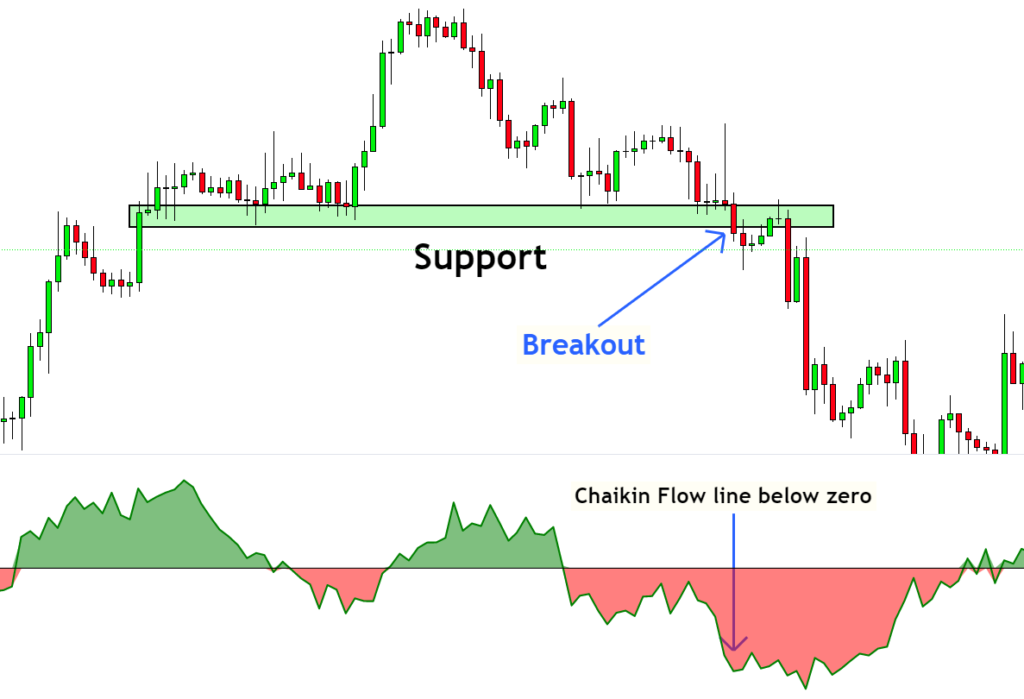
Support or resistance breakout
If you’re trading with a breakout strategy, then by adding the confluence of the Chaikin money flow, the winning probability of support or resistance breakout increases.
Open a sell order when the price breaks and the support and Chaikin flow line is below the zero line. On the other hand, if the price breaks the resistance and the Chaikin flow line is above the zero line, then open a buy order.
Divergence trading
Divergence trading also works with Chaikin money flow indicators like other oscillators. There are two types of divergence in trading.
- Bullish divergence
- Bearish divergence
Bearish divergence
If the Chaikin indicator line is making higher lows while the price is making higher highs, there’s a bearish divergence.
Bullish divergence
If the Chaikin indicator line is making higher highs while the price is making lower lows, this phenomenon shows a bullish divergence.
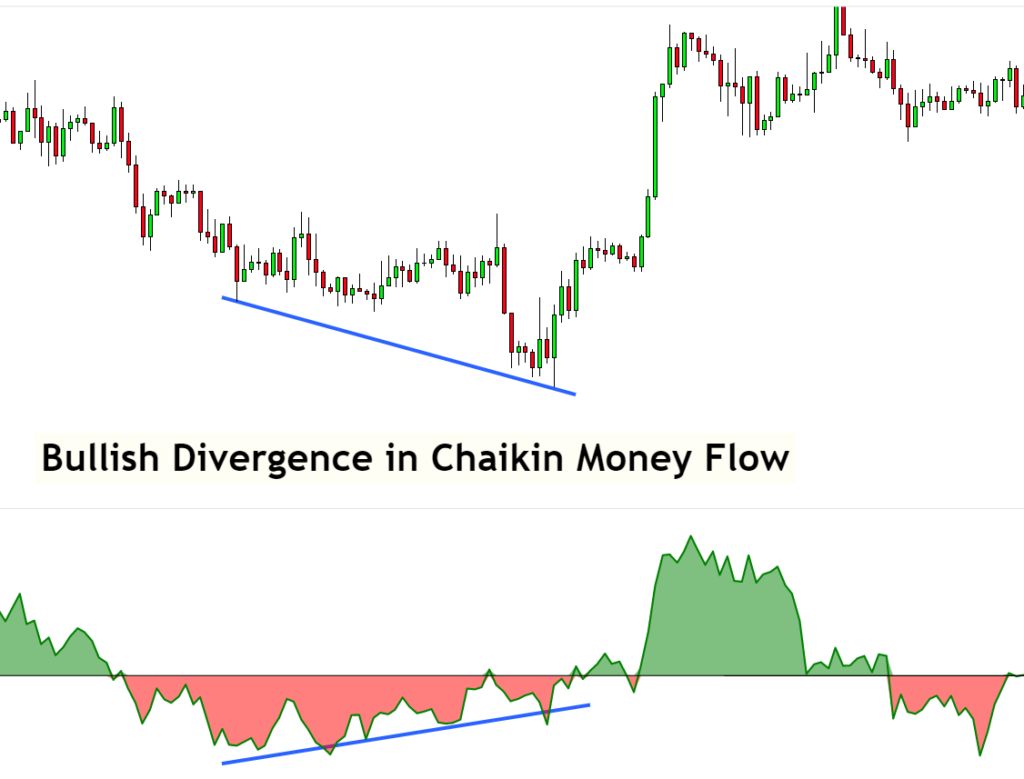
You should buy in case of bullish divergence and open sell orders in case of bearish divergence.
The bottom line
The Chaikin money flow indicator is good if used with the price action strategy. I will not recommend entirely relying on a single indicator. You should not invest your hard-earned money in analysing a single indicator. But if you use the confluence of price action and chaikin flow indicator, you can profit from the market.
Don’t forget to ask in the comments if you have any questions.