
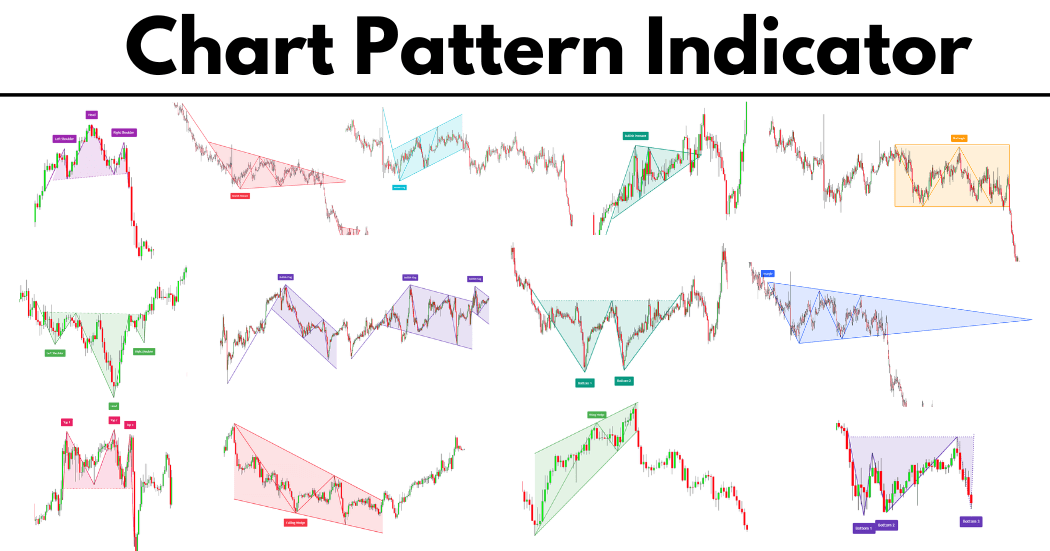
chart pattern indicator is a technical indicator that identifies the chart patterns on the candlestick chart to predict the trend in trading.
The price chart of every currency pair or financial asset shows natural behaviour by making patterns like triangle, rectangle and head & shoulders. That’s why retail traders use these patterns to predict the future direction of price in technical analysis. The chart patterns repeat with different intervals of time. And it’s easy to make a profitable trading strategy using chart patterns.
However, finding the accurate chart patterns on many currency pairs is difficult because you must sit in front of a screen most of the time. Sometimes you will also miss many profitable trade setups. To fix this issue, you can use the chart patterns indicator to do 80% of the work for you.
I know that a programmed algorithm can make mistakes too. That’s why I don’t recommend entirely relying on the indicator. Still, I suggest using the indicator for finding chart patterns and then deciding whether to trade a chart pattern. This will surely improve your trading strategy.
Here I will explain the chart patterns indicator that will plot the patterns automatically on the tradingview platform. So you don’t need to sit in front of the screen. But you can save time using this indicator if you are a chart patterns trader.
How does the chart pattern indicator work?
There are 14 indicators based on different chart patterns available on tradingview.
- Triangle pattern indicator
- Rectangle pattern indicator
- Double top indicator
- Double bottom indicator
- Triple bottom indicator
- Triple top indicator
- Bullish flag pattern indicator
- Bearish flag pattern indicator
- Rising wedge pattern indicator
- Falling wedge indicator
- Bullish pennant indicator
- Bearish pennant indicator
- Head and shoulders pattern indicator
- Inverse head and shoulders pattern indicator
When you add specific chart patterns to the chart, it will scan the chart to meet the conditions. If you are a chart patterns trader, you should surely use these chart pattern indicators in tradingview.
I will show you the demo of each chart pattern indicator with a short explanation, so keep reading.
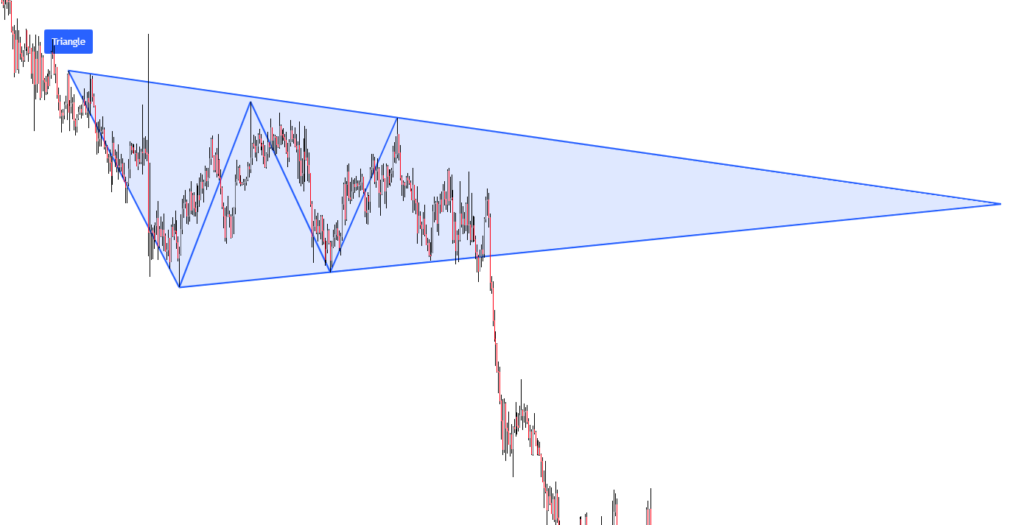
Triangle pattern indicator
In the triangle pattern, the length of each successive wave continues to decrease, and the price forms a triangle shape on the candlestick chart. After the triangle pattern breakout, the price continues the previous trend. That’s why it is used as a trend continuation chart pattern.
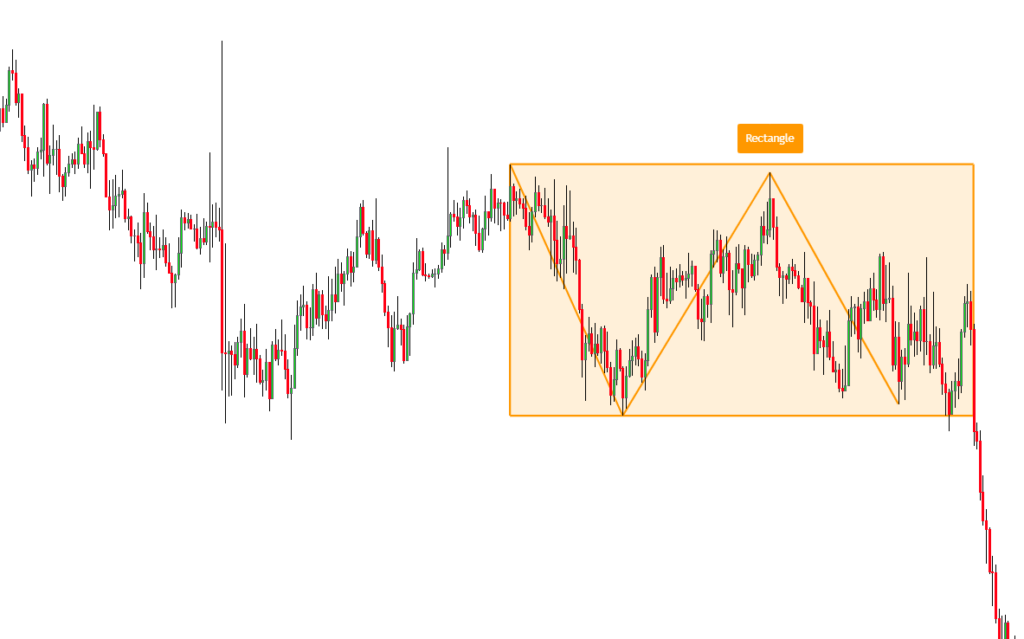
Rectangle pattern indicator
The rectangle pattern represents the sideways/ranging price on the candlestick chart. The market shows no bullish or bearish trend, and the price is moving sideways. After the chart patterns indicator breakout, the price follows the previous trend. So it is a trend continuation chart pattern.
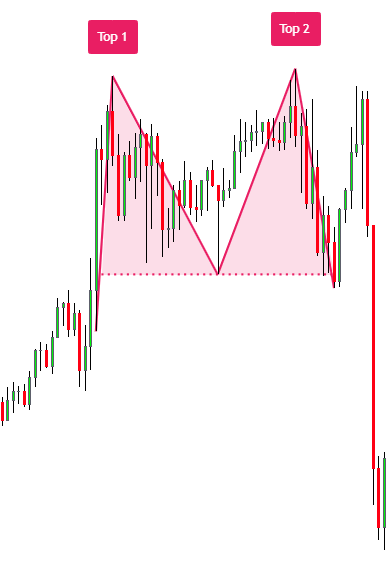
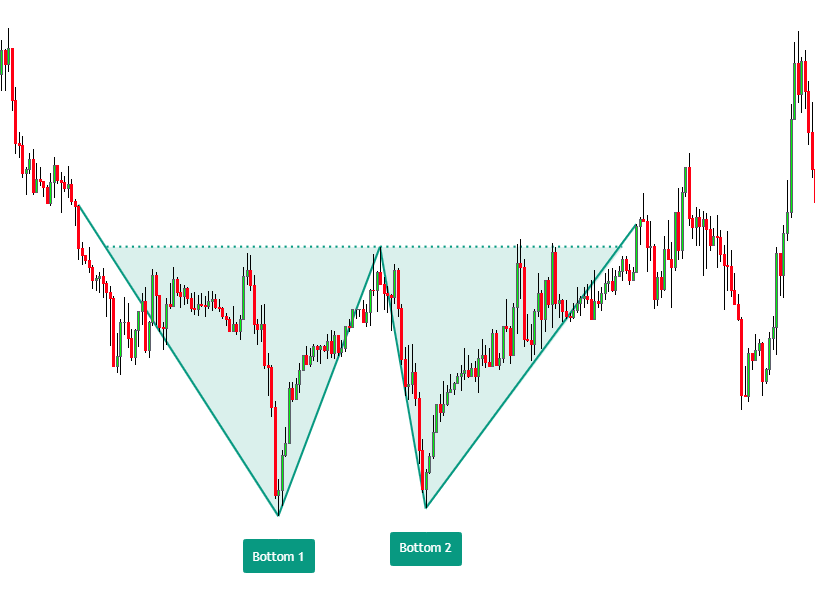
Double top and bottom pattern indicator
Double top and double bottom are two trend reversal patterns. The double top forecasts a bearish trend reversal, while the double bottom shows a bullish trend reversal.
In the double top pattern, the price will make two tops. These two tops act as a swing high. After these two tops, a bearish trend reversal occurs.
In the double bottom pattern, the price makes two bottoms, and these bottom price points act as a swing low. After the formation of these swing lows, a bullish trend reversal occurs.
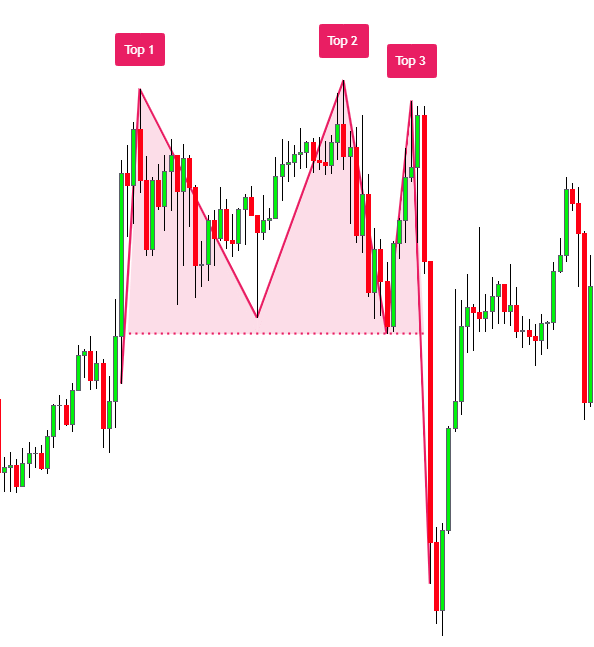
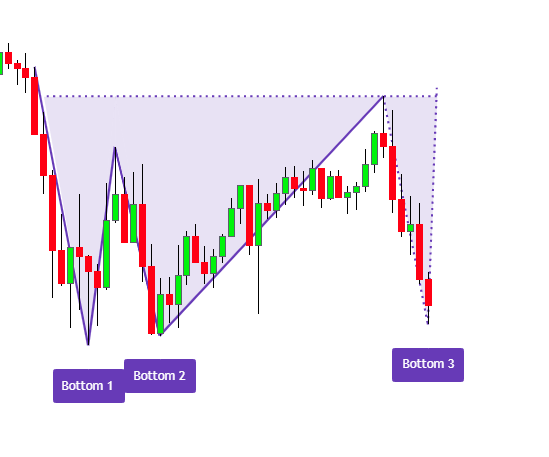
Triple bottom and top pattern indicator
Triple top and bottom chart patterns are trend reversal patterns. The indicator will plot a triple bottom pattern when three price bottoms at the same price zone form. These bottom points are also known as swing lows.
On the other hand, this indicator will plot a triple top pattern when three price tops form in the same price zone, as shown in the picture below.
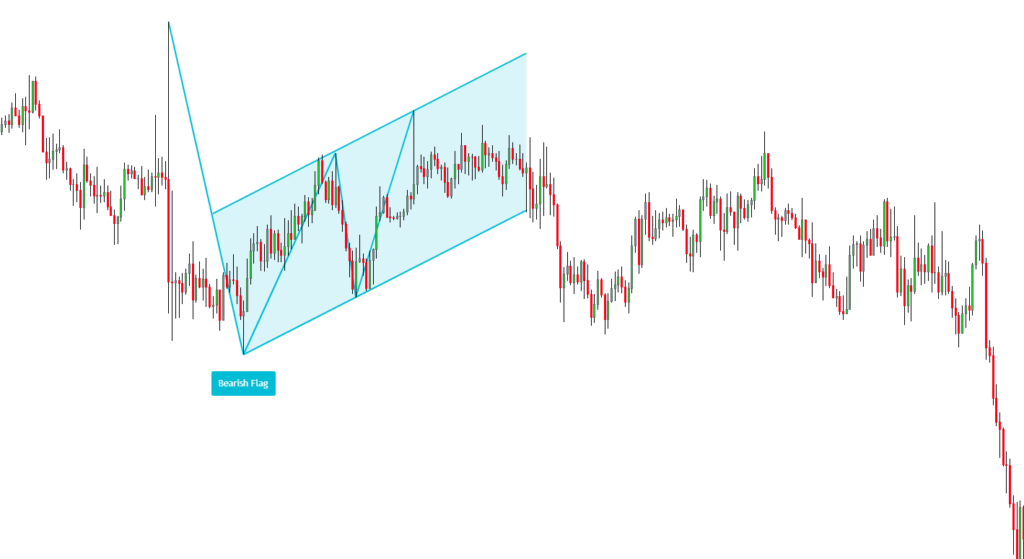
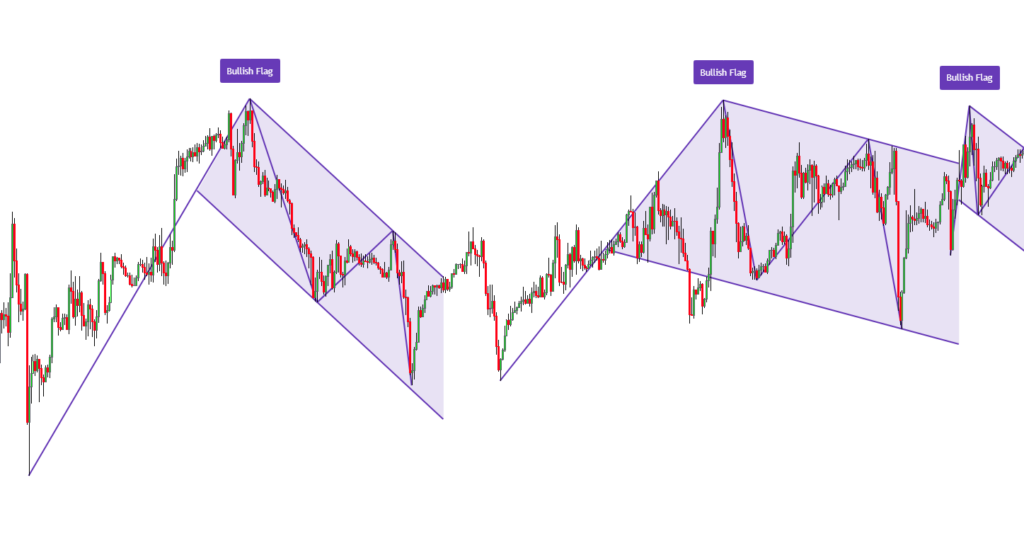
Flag pattern indicator
The flag pattern indicator plots a bearish and bullish flag pattern on the candlestick chart. The flag pattern consists of an impulsive wave and a retracement price channel. After the retracement channel breakout, the price continues the previous trend.
These two patterns act as trend continuation chart patterns.
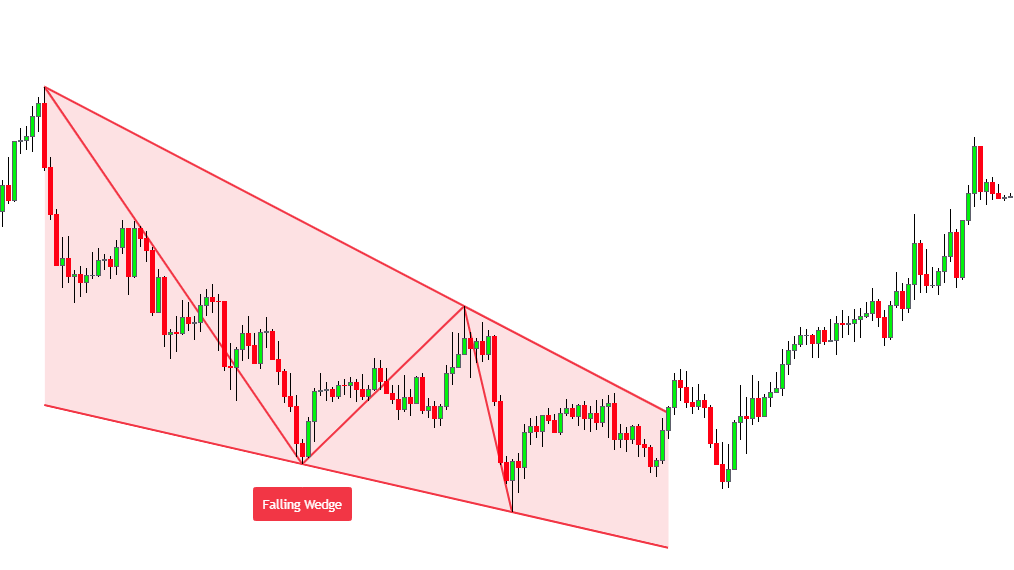
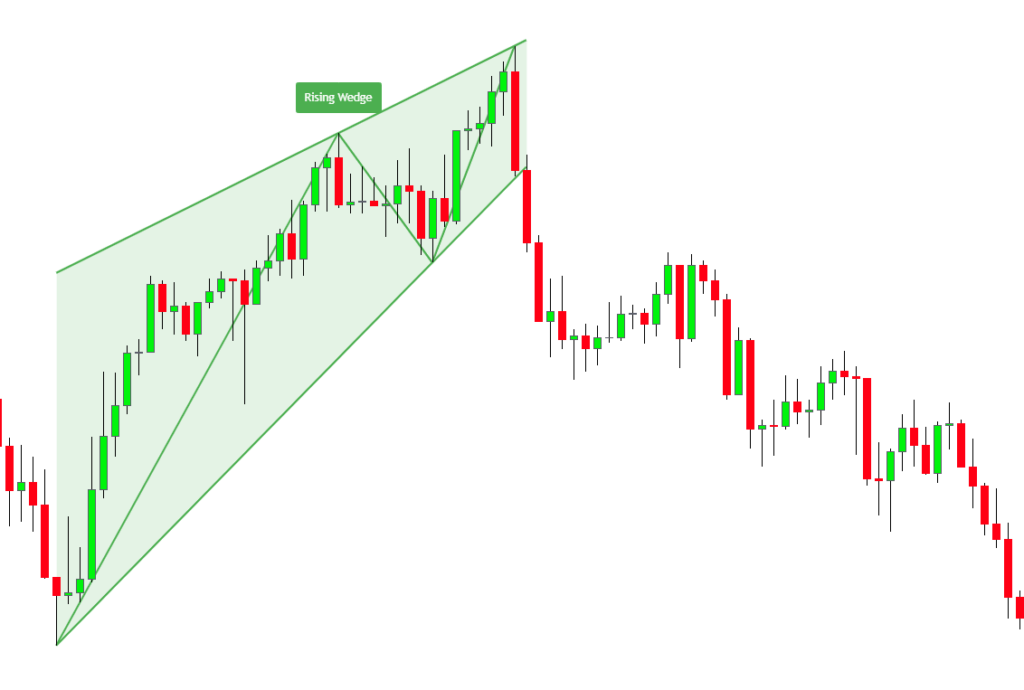
Wedge pattern indicator
There are two types of wedge patterns in technical analysis.
- Falling wedge pattern
- Rising wedge pattern
There is a separate indicator for each pattern in tradingview. The falling wedge pattern indicator identifies the wedge shape price structure. After the breakout of the falling wedge pattern, a bullish trend reversal occurs.
On the other hand, the rising wedge pattern acts as a bearish trend reversal pattern.
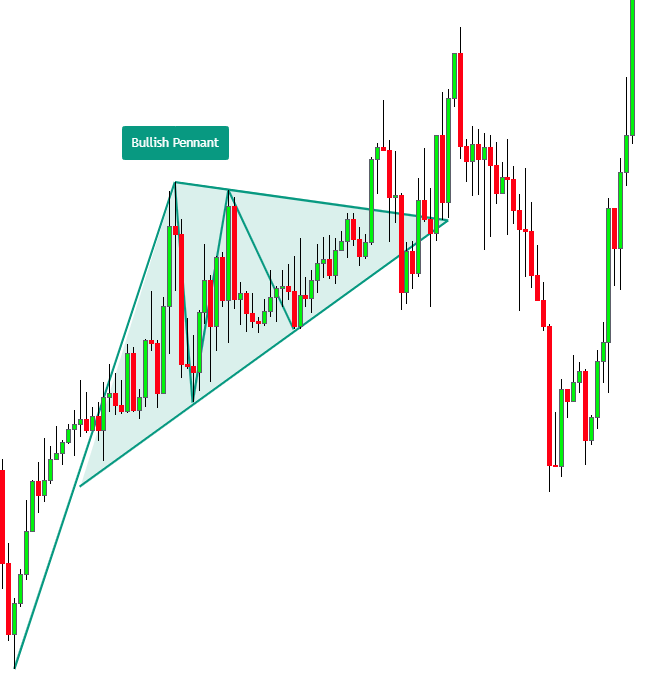
Pennant pattern indicator
Pennant is a trend continuation chart pattern that mainly forms in the trending market conditions. You can use the pennant pattern indicator to identify this chart pattern quickly.
Pennant pattern is also further categorized into a bullish and bearish pattern. There is a separate indicator for each pattern in the tradingview platform.
Below is the image of the chart pattern identified by the pennant pattern indicator.
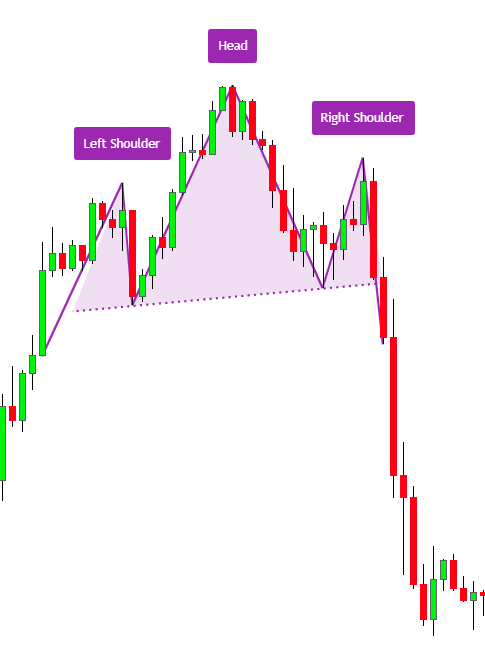
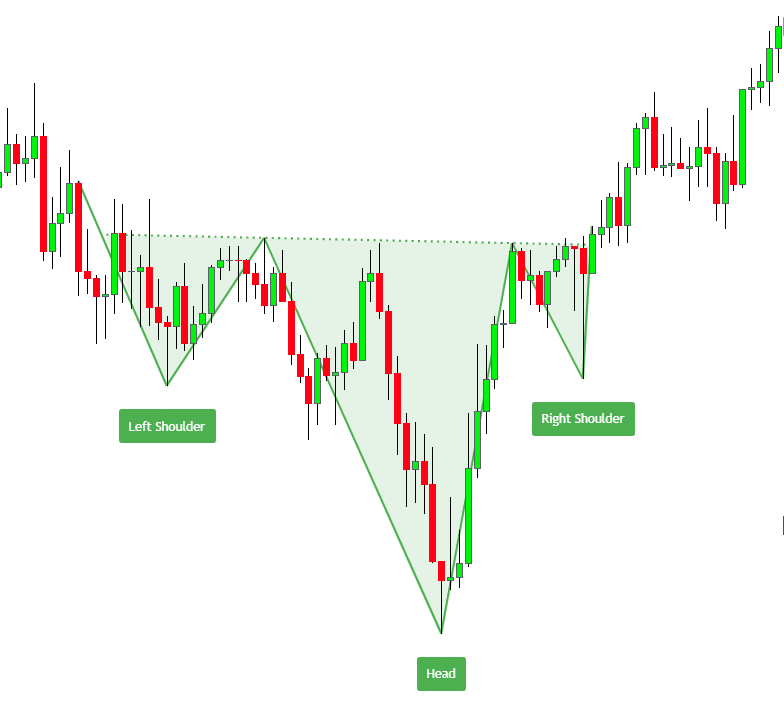
Head and shoulders & inverse head and shoulders pattern indicator
Head and shoulders is also a reversal chart pattern. Days are gone when traders manually check each chart pattern, but now you can use the indicator with highly accurate results.
When a simple head and shoulders pattern forms, a bearish trend reversal occurs in the market. On the other hand, a bullish trend reversal forms in the case of an inverse head and shoulders pattern.
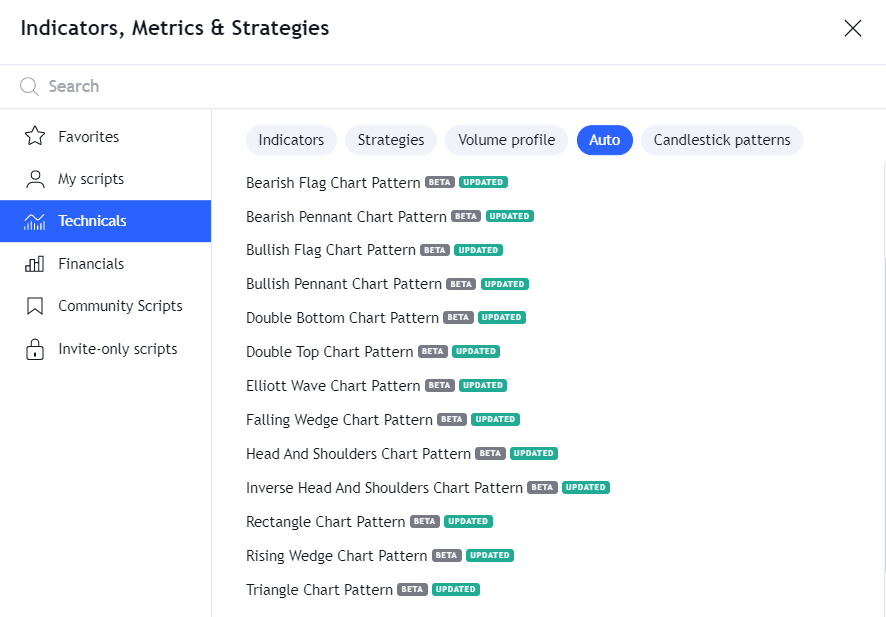
How to access the chart pattern indicators?
These indicators are available for free in tradingview. If you are using the MetaTrader, you won’t be able to use these chart pattern indicators.
- To use the indicator, open the candlestick chart of any currency pair or financial asset.
- Click on the indicators button in the header of the tradingview tools panel.
- Select the Technical indicators and choose the required chart pattern indicator from the “Auto” tab.
The bottom line
These above 14 chart patterns can be identified using the indicator accurately. The tradingview team has developed these indicators and is continuously updating them to increase the precision of each indicator. I highly recommend retail traders use these chart pattern indicators to save 80% of their time and invest the rest of the 20% of their time in making good decisions in trading.
This will make you a profitable trader.