
Definition
The Change of character in trading represents the trend reversal in the market after a break of Highs/Lows. It is also known as CHoCh in trading.
This pattern is similar to the Quasimodo pattern. Only the name is different, but the pattern is the same. However, quasimodo pattern is a different trading strategy related to supply and demand.
In this article, I will explain the ChoCh pattern in detail and will also explain a supply and demand trading strategy with the confluence of change of character trading pattern.
How to identify the change of character pattern?
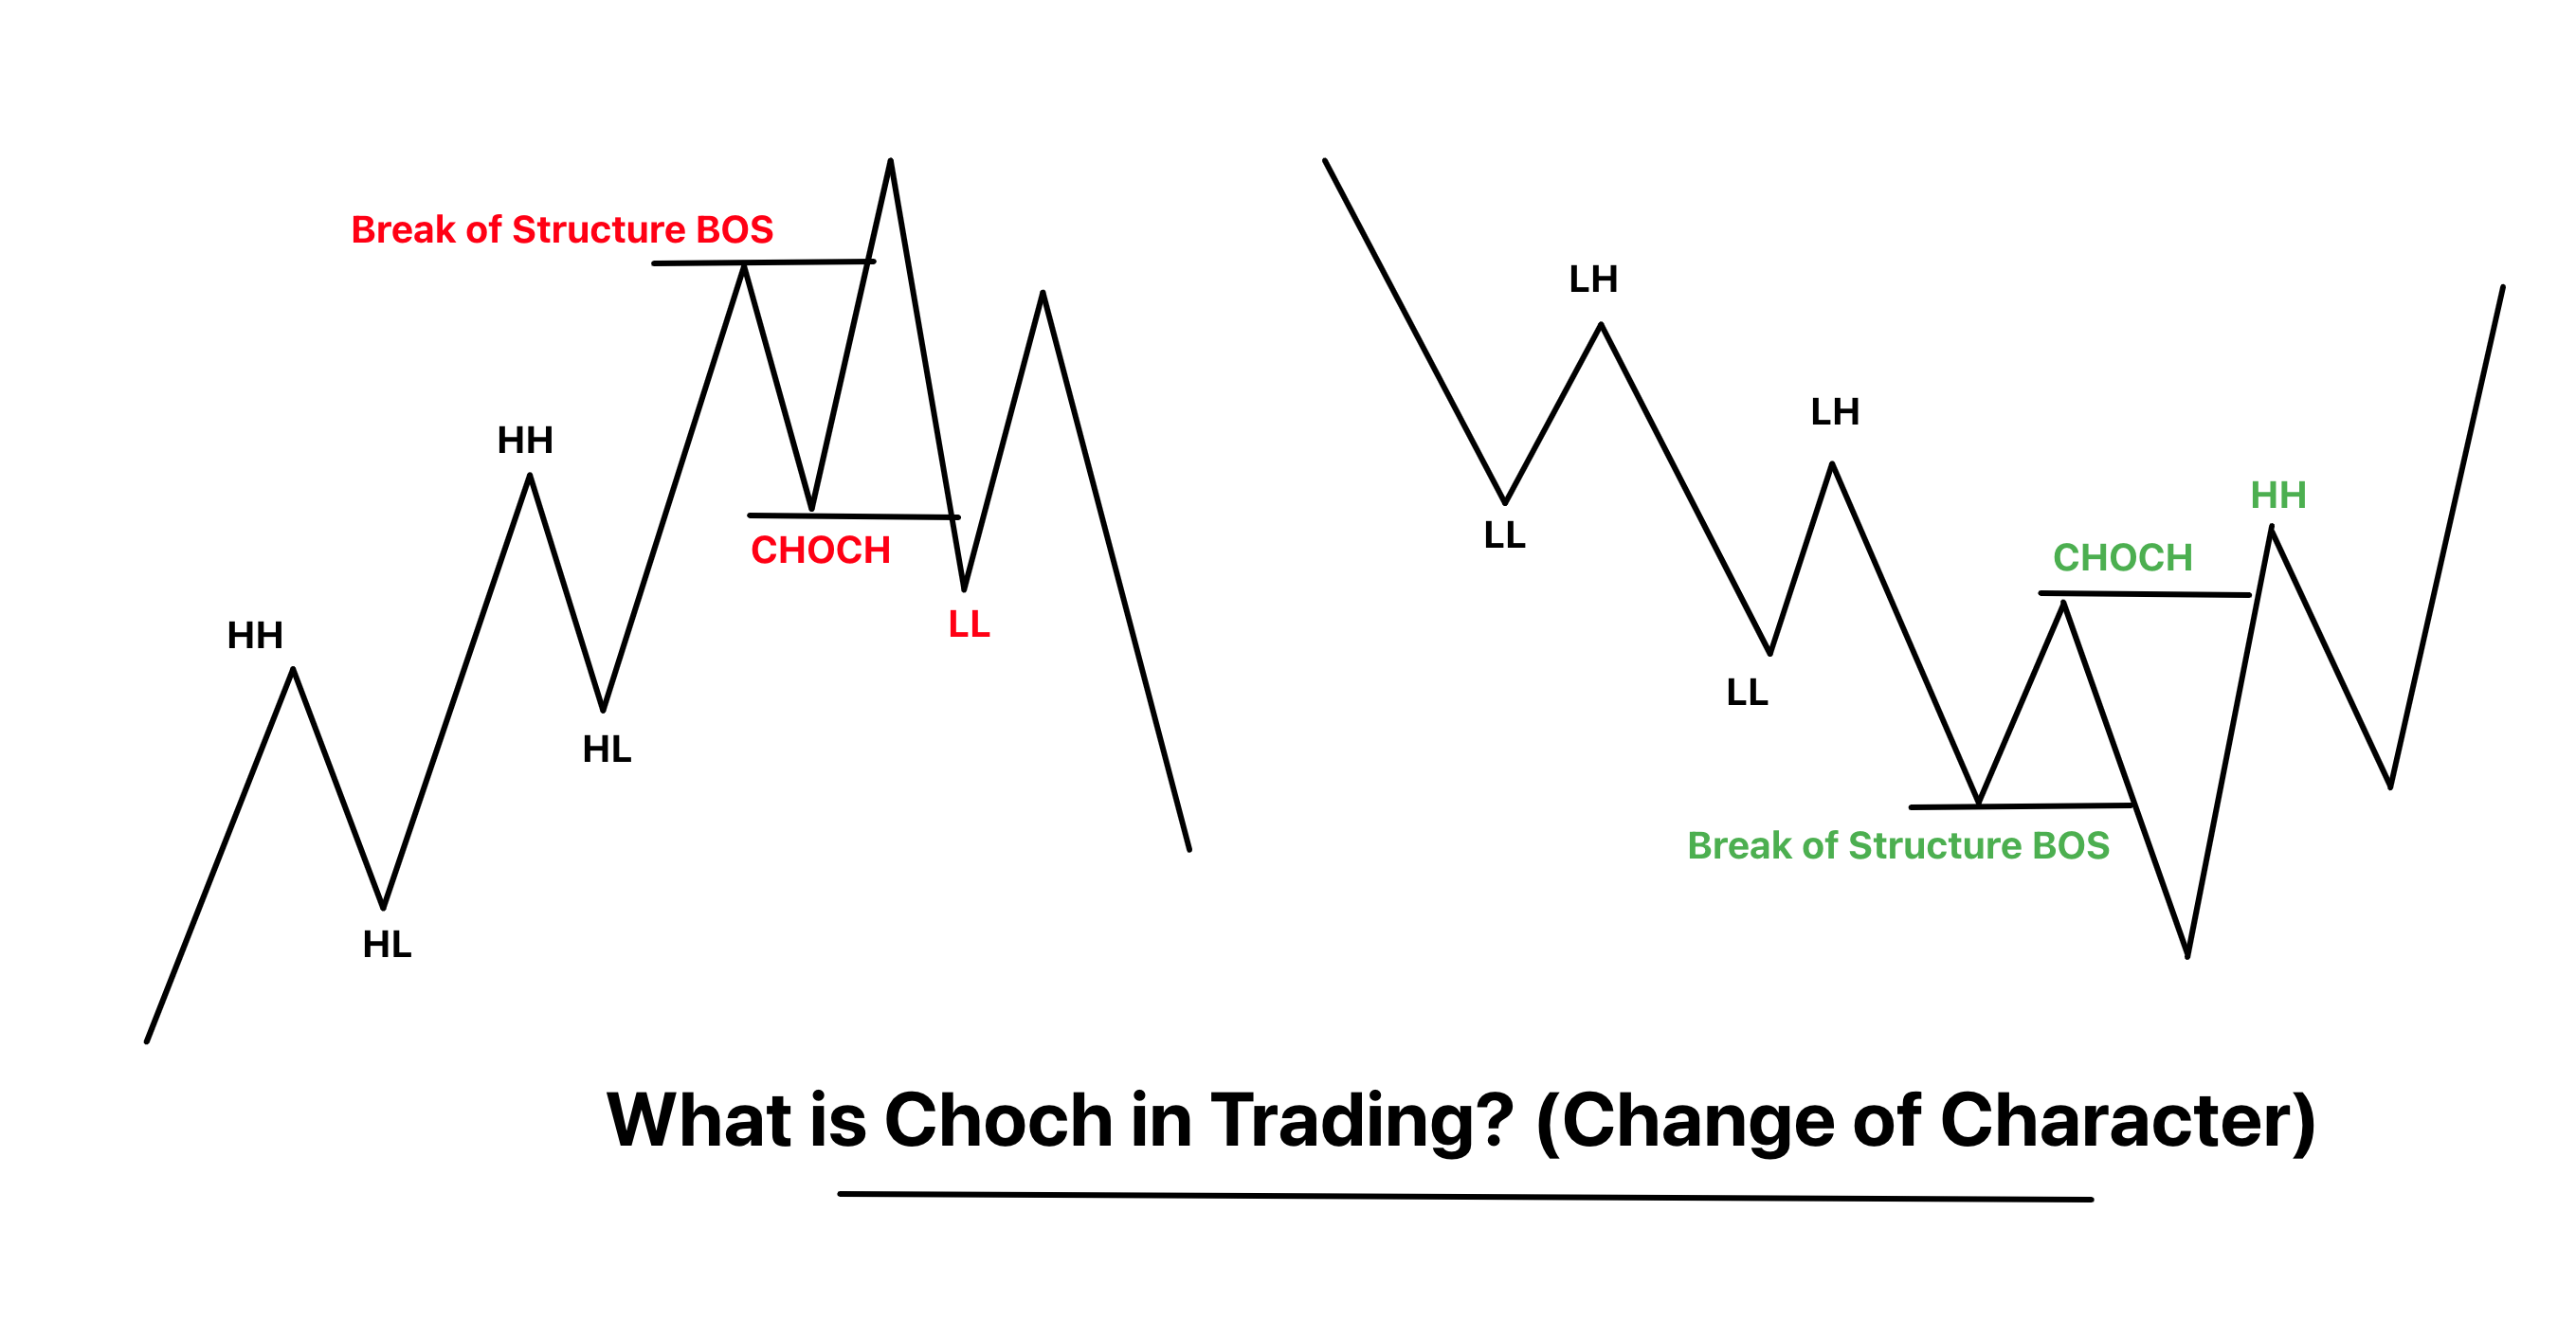
To find the choch pattern on the candlestick chart, you should follow the following set of rules:
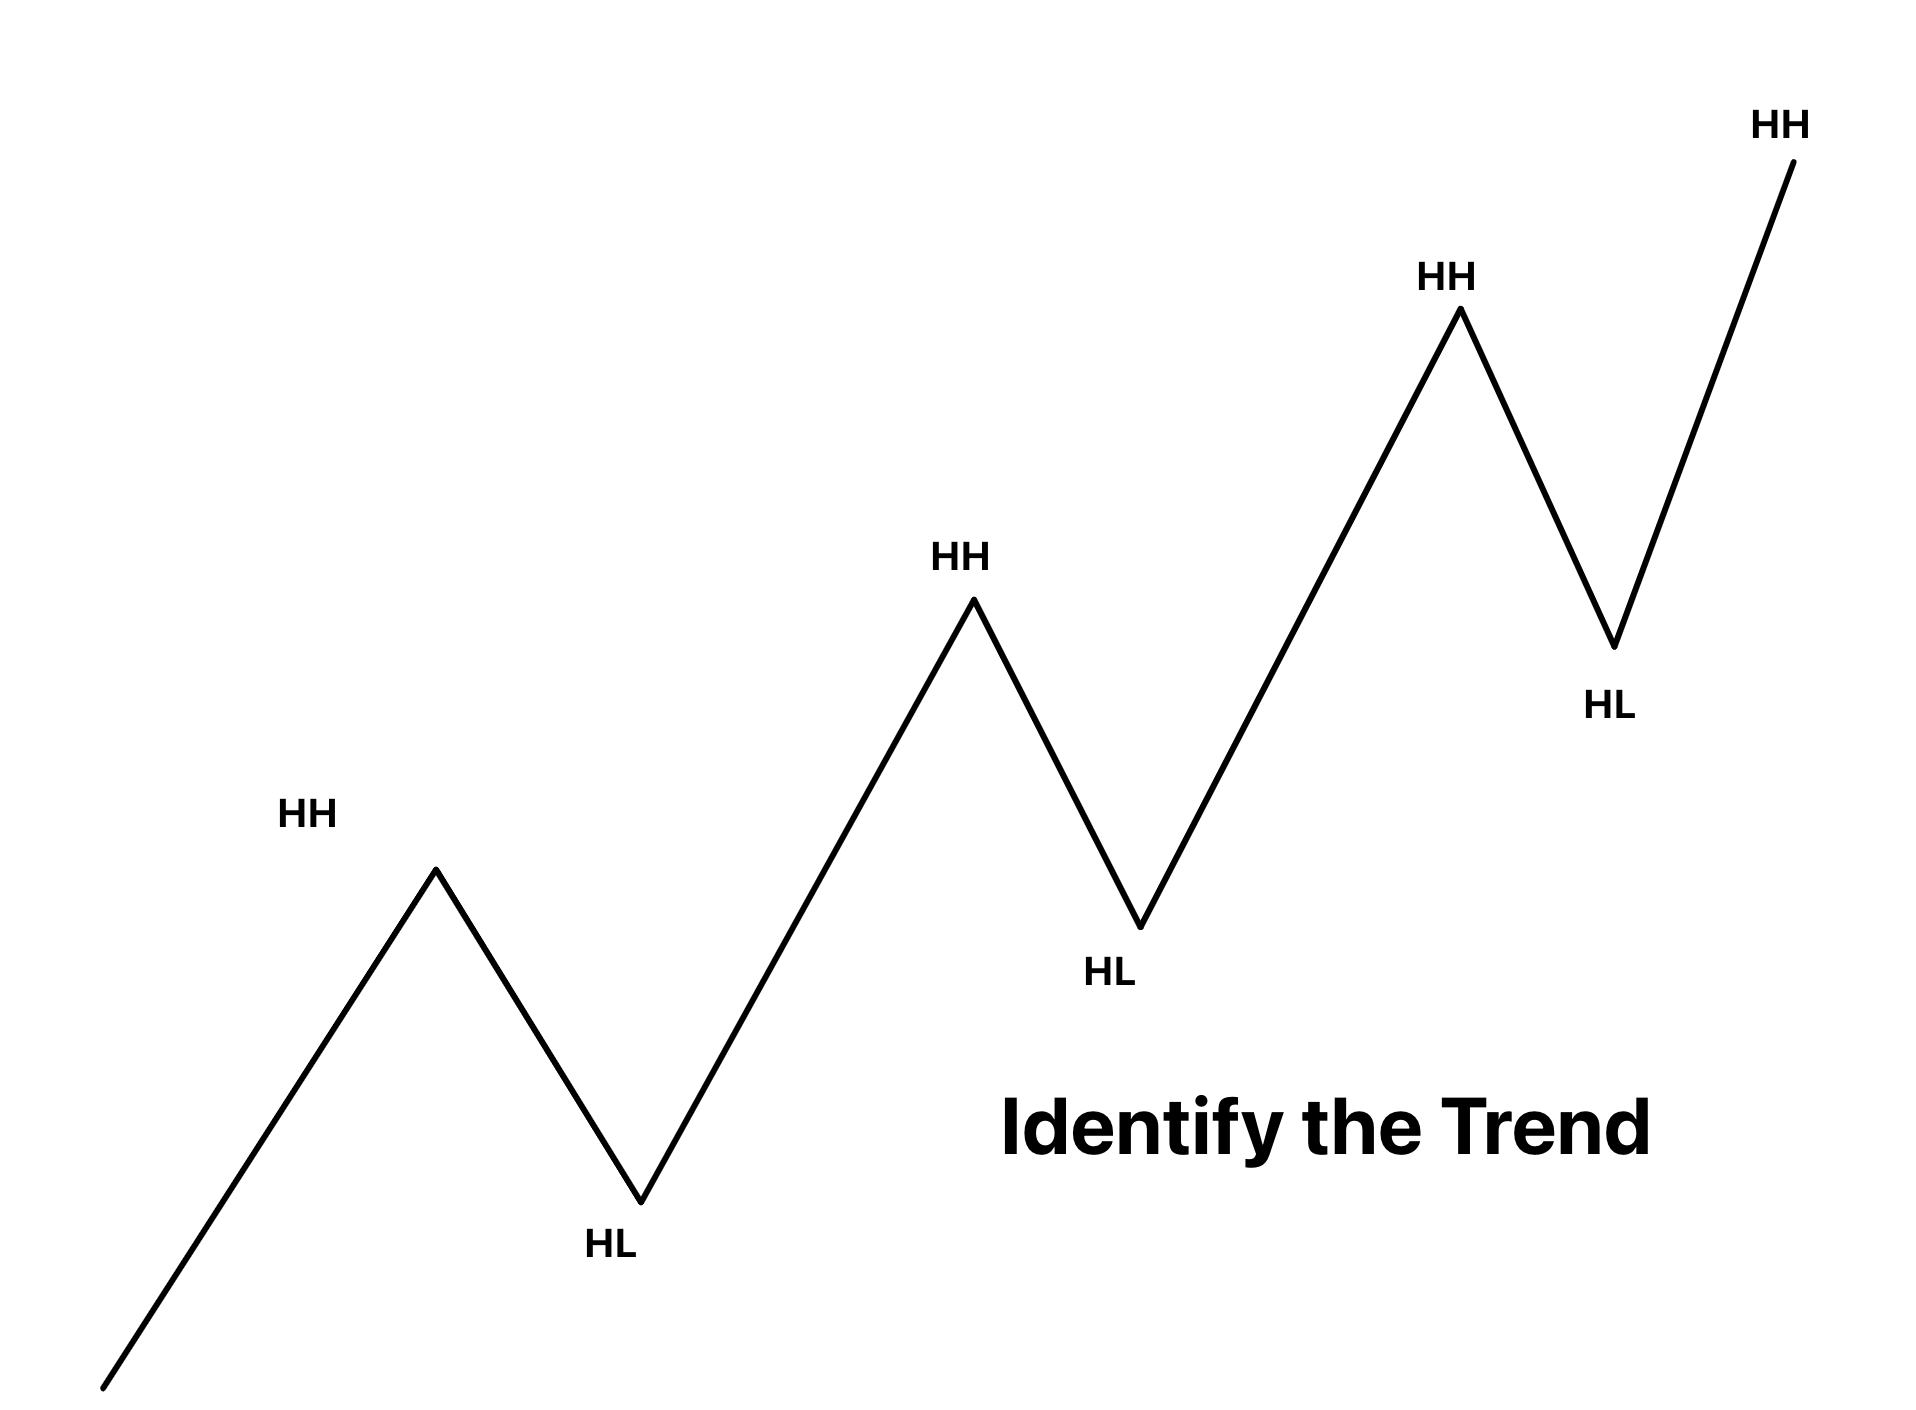
- Identify the prior trend: first, find the prevailing trend in the market using the higher or lower lows method.
- Break of structure: it means the break of a lower low in the case of a bearish trend, while during the bullish trend, it means the break of a higher high. BOS also represents it in forex.
- Break of lower high or higher low: after the break of structure, the price will reverse to change the trend. Then it will break the recent LHs or HLs. In the case of a bullish trend, the price will break the higher lows, while during a bearish trend, the price will break the lower highs.
- Trend change: after the above steps, the price will change its trend. This is known as a change of character in the market. For example, if the last character of the market was bullish, then it has been changed to bearish.
You must follow the above steps in a sequence from step 1 to step 4. I will also highly recommend learning about the swing high or swing low. These two concepts will help you to find a valid breakout.
What does the change of character tell traders in the real market?
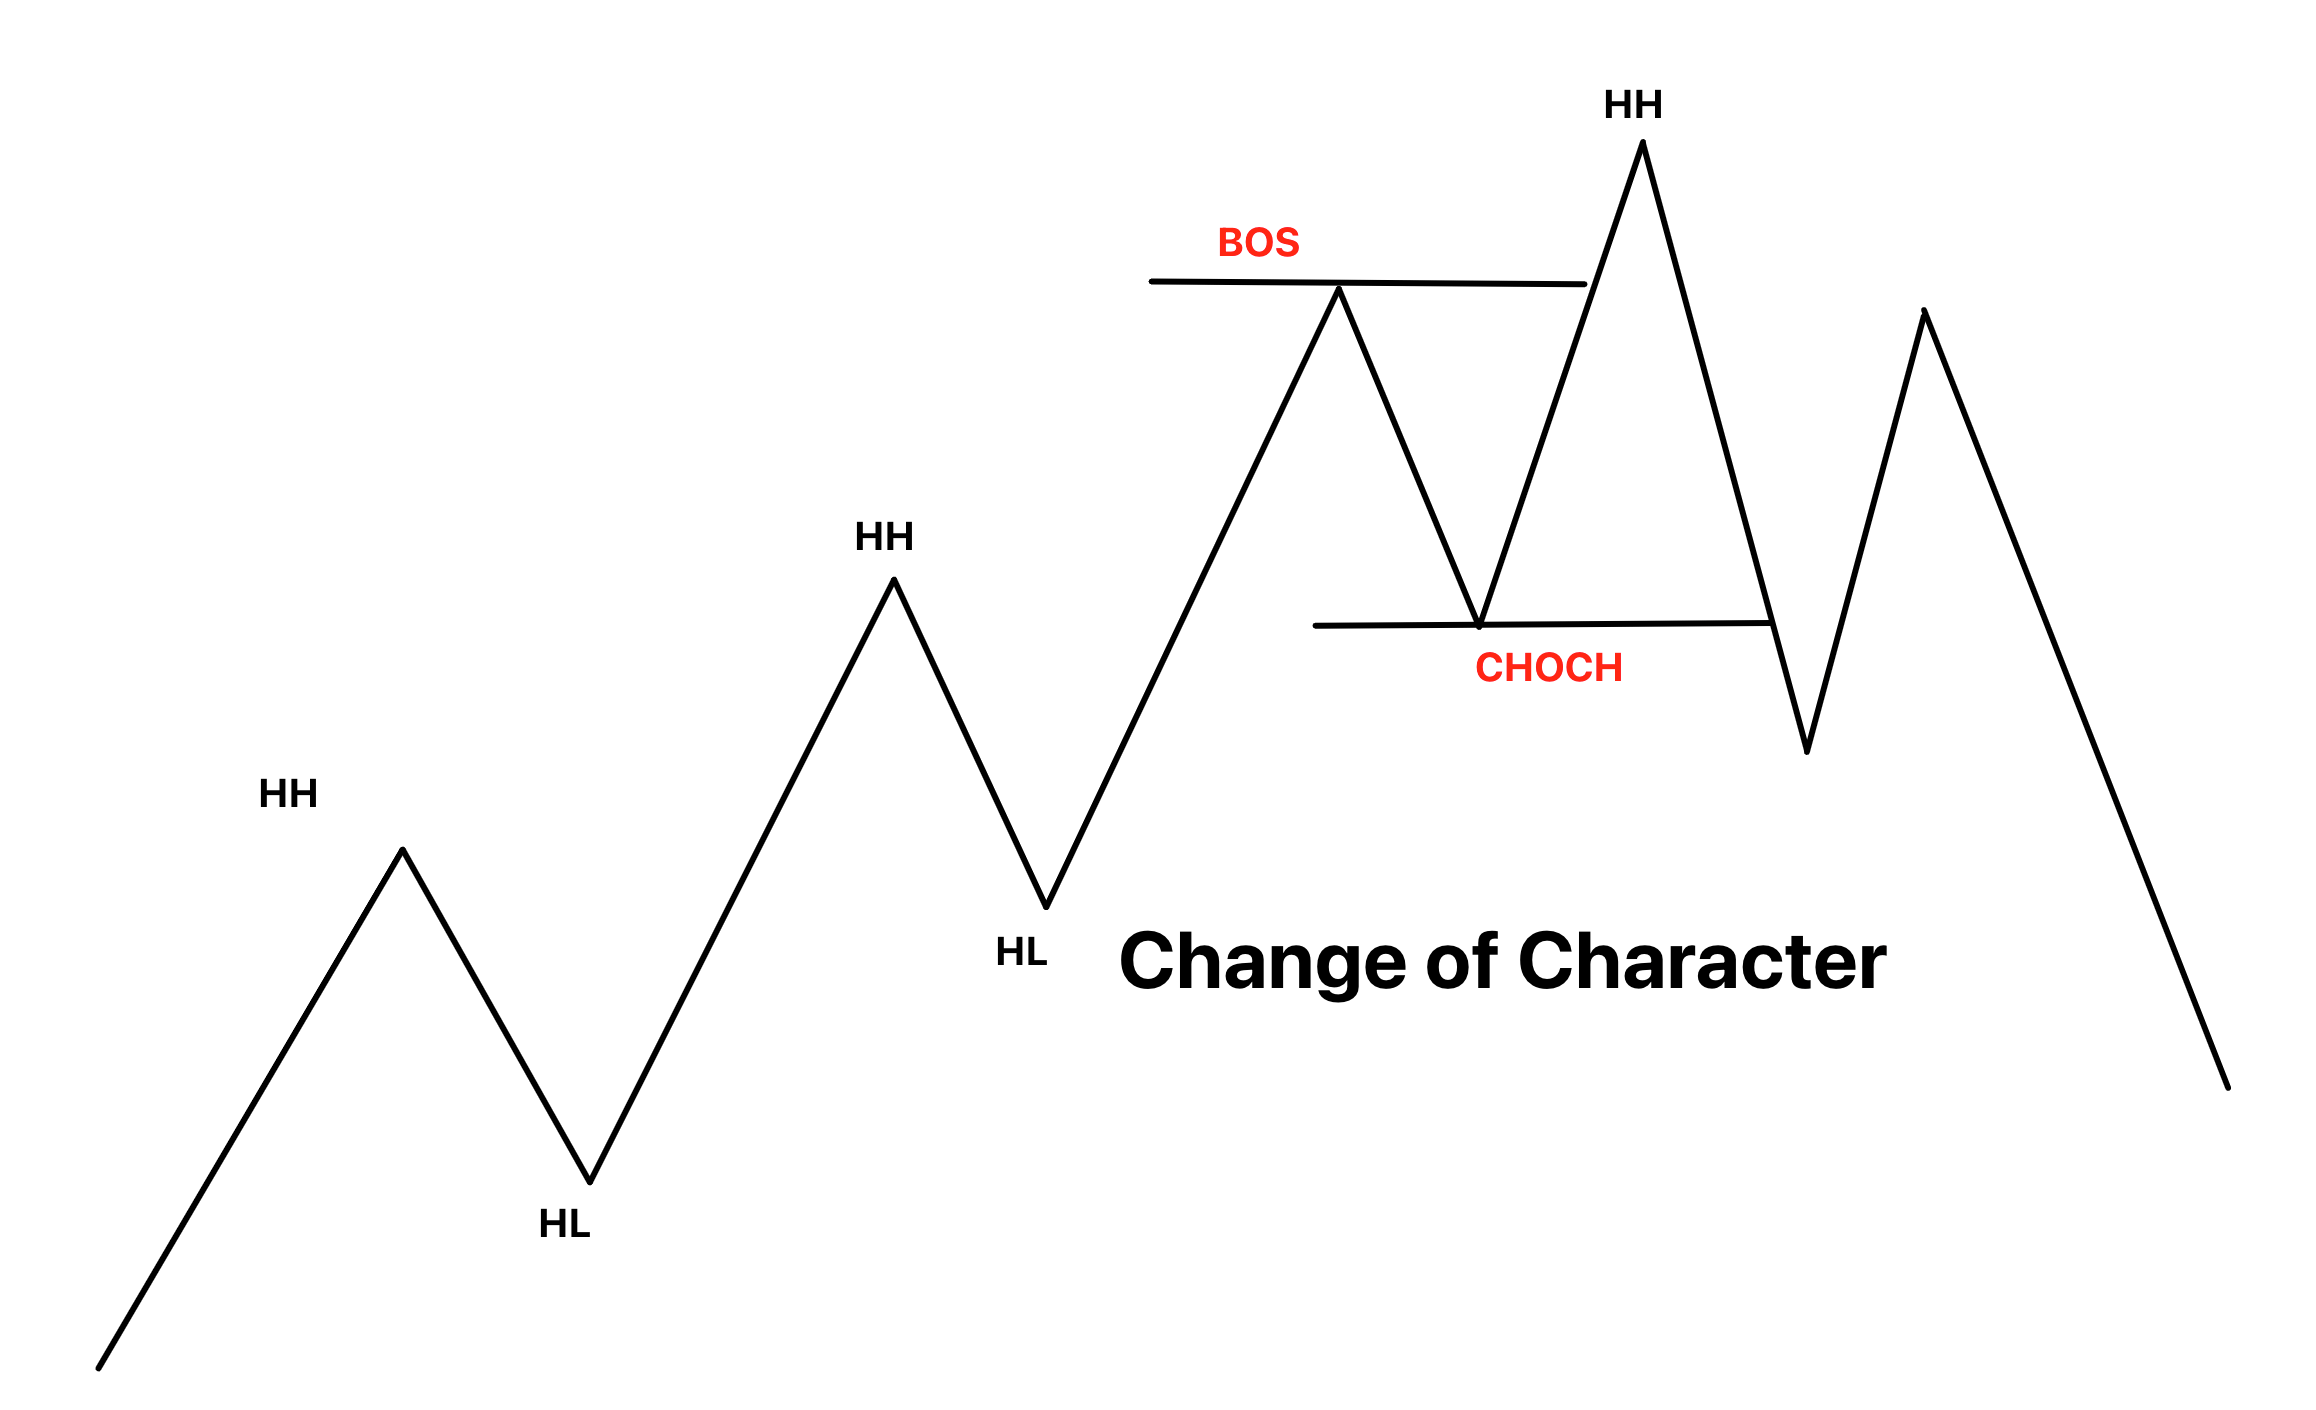
The Choch is the most simple concept in technical analysis. It is based on the market waves, and the structure of the waves shows us the trend reversal in the market.
For example, bullish waveforms when a series of higher and lower highs form on the chart. It means buyers are stronger, and they are pushing up the market. However, when the last higher high and higher low break with specific criteria, as explained above, then the market trend changes. This change is a change of character.
After a change of character pattern, the market trend will reverse. So if you were holding a bullish trend, you should close the trade and look for a sell trade opportunity in the bearish trend.
This is the primary technique used in technical analysis to forecast the market using trends and other technical tools.
Examples 1
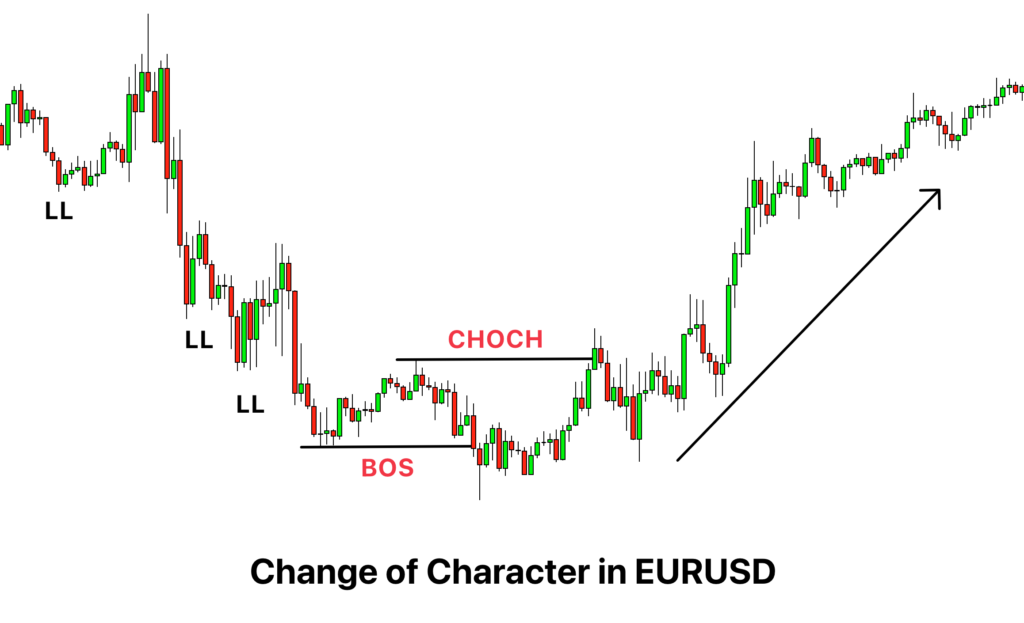
In EURUSD, you can see a clear formation of higher and lower highs. It means the trend is bullish. I have also marked these levels on the chart.
Now, the price has broken the higher high at the end of a trend. It is the break of structure.
After the break of structure, the price reversed, and a new lower low f. It means a trend reversal has been initiated in the market. After a minor pullback, the price will start making lower lows and lower highs. It is a signal of a bearish trend.
Example 2
The choch pattern works for all markets like stocks, forex and cryptocurrency.
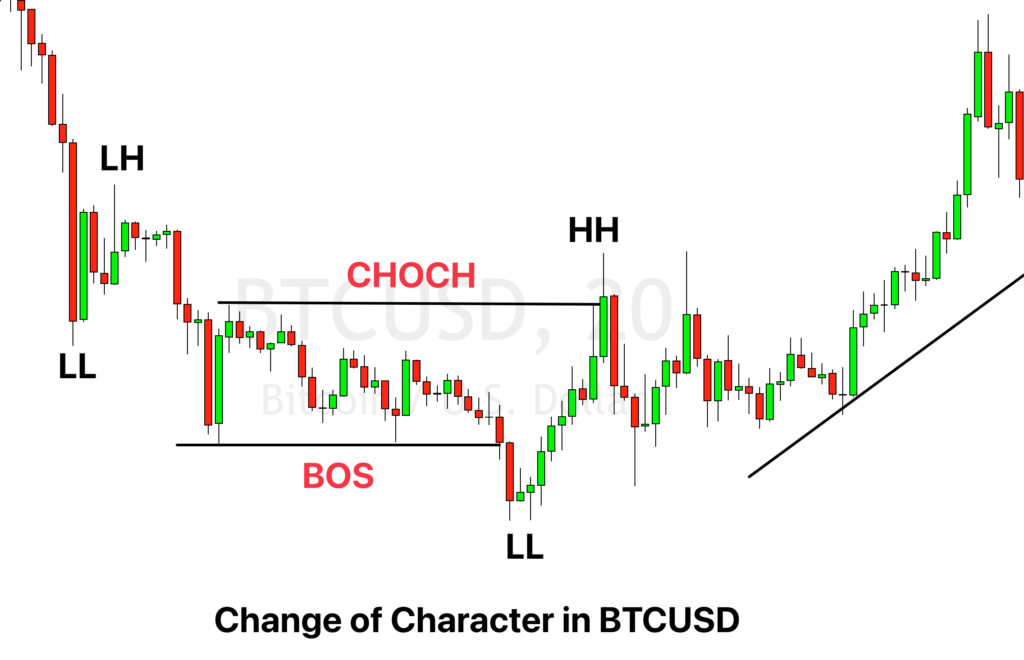
Here is an example of the choch pattern in BTCUSD. After a series of bearish trend, the price breaks the lower high, and then a change of character pattern forms.
ChoCh trading strategy
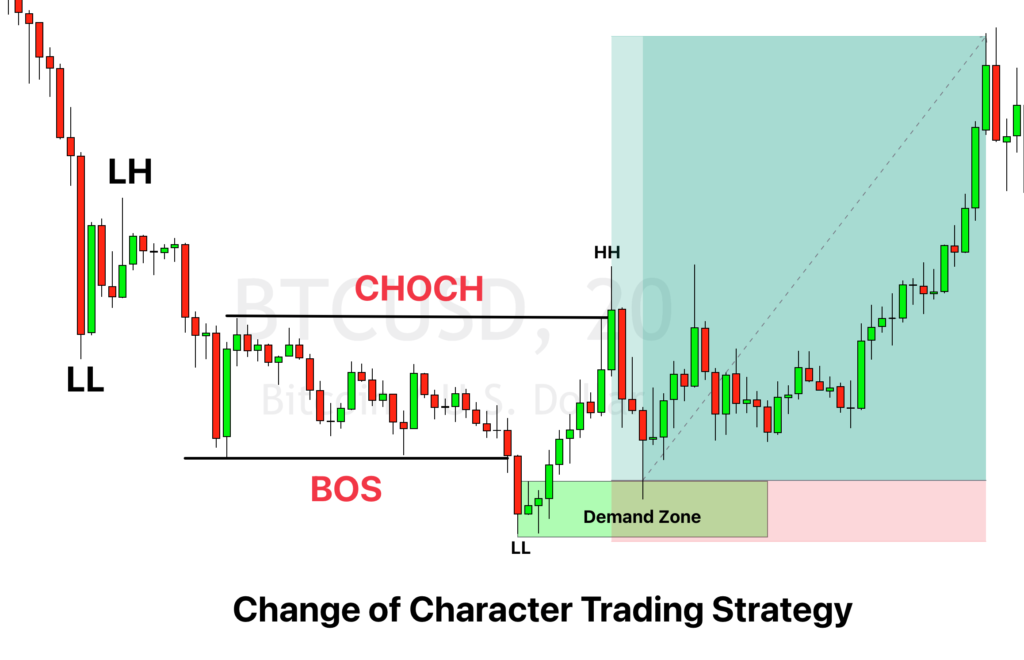
In the trading strategy, I have added a confluence of supply and demand zones with the change of character pattern in trading. After confirmation of the trend reversal, we will use the supply and demand zones to open the trade and stop loss level. Then, we’ll close the trade once another Choch pattern forms in the opposite direction.
So follow the following steps:
- Open a trade: When a Choch pattern forms, mark a supply/demand zone based on the recent wave. And then wait for the price to retrace to the zone and then open trade in the direction of a trend reversal.
- Add the stop loss level: Put the stop loss a few pips above the supply zone and place the stop loss below the zone in case of the demand zone.
- Take profit: close the trade manually when a counter-trend choch pattern forms on the chart.
This is one of the best trading strategies, giving very high-risk rewards. Because sometimes the trend changes after a big trend, you’ll get massive profits.

Conclusion
Supply and demand is the best trading strategy I use in trading. I’m also a supply and demand trader. The high probability trade setups form on the chart with the combination of choch pattern and supply-demand zones.
However, you must backtest the trading strategy because you should also be able to find good market conditions. Because the probability of trading setups decreases in choppy market conditions.
Hi sir thanks for good informative and good video and website tutorial, plz keep it up, , but u didnt draw choch in video chart , where we can find free choch and BOS indicator non repaint and EA based on it sir? bearish CHOCH is called if price is forming HH/HLS two or more and one LL has established that means CHANGE OF CHARACTER SIR? thanks
My return to the financial market has been encouraging, but I was having a great challenge with identifying Choch, after carefully reading this article I have no doubts the challenge is now in the past. Thank you so much for sharing this in the manner you have.