
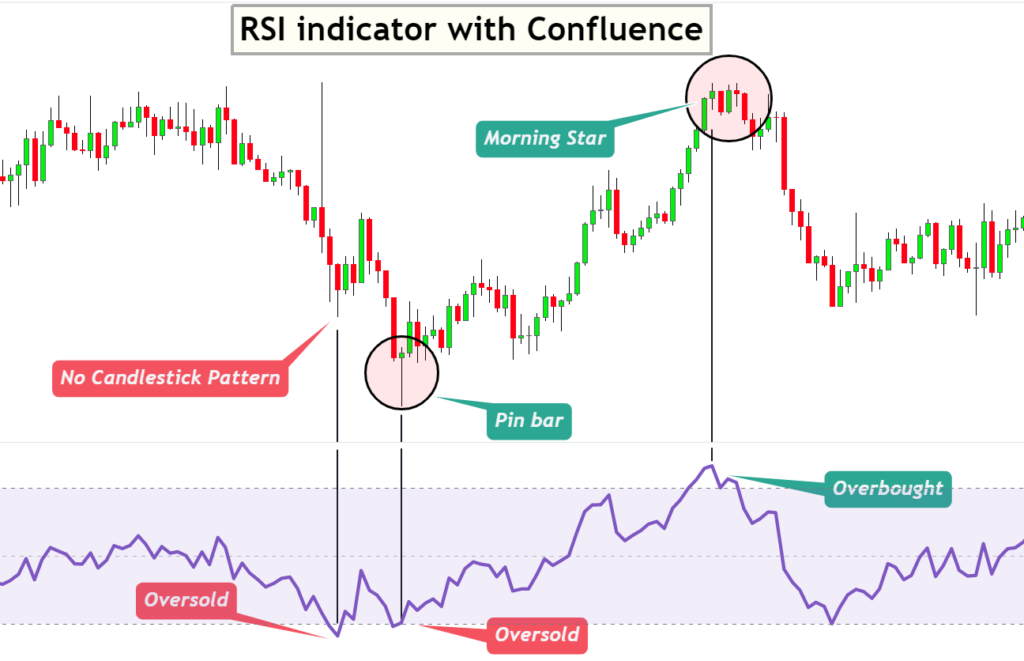
Confluence is the addition of technical tools to filter excellent and high-probability trade setups in forex. For example, suppose the RSI tool indicates the overbought condition on the chart. If you add a confluence of a bearish candlestick pattern, the probability of a bearish trend reversal will increase. Here candlestick pattern is confluence.
Trading is a game of probabilities. You’ll lose if your trading strategy has low winning and risk-reward ratios. It doesn’t mean you will have to find another strategy, but you must optimise your existing strategy using the confluences. Using confluences will increase the winning ratio of the strategy.
How does the confluence work in trading?
The confluence also works as a confirmation in a trading strategy. Before adding confluence, you must understand the type of your trading strategy based on the price action or technical indicators. Then add the confluence accordingly.
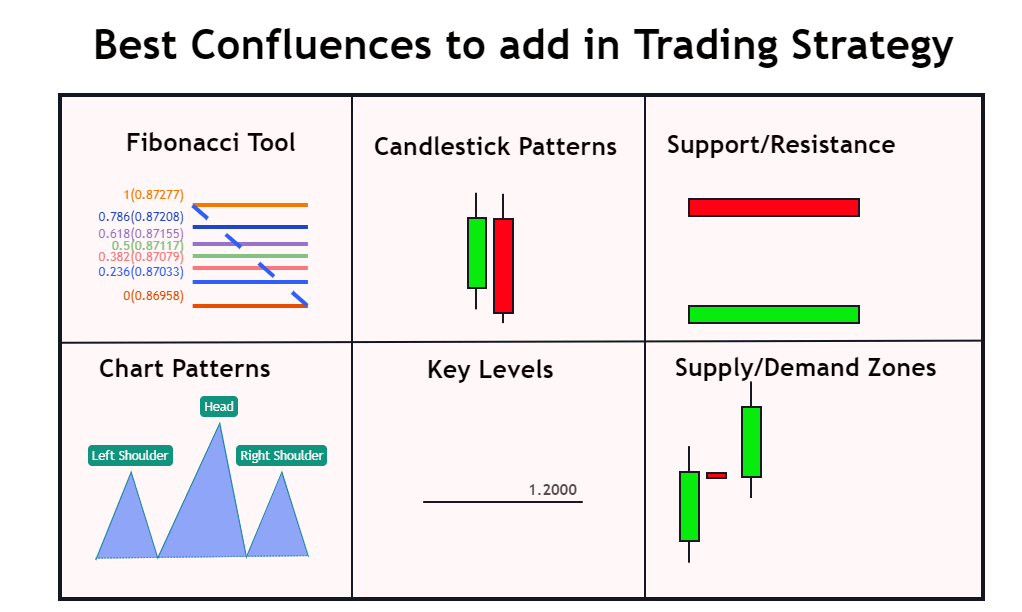
However, in my opinion, adding price action confluence is the best. It means you can add the following technical tools as a confluence
- Candlestick patterns
- Fibonacci golden zone
- Key levels
- S&D zones
- Chart patterns
These are five popular confluences that I use. It does not mean I use all five confluences for a single trade setup. I use one to two confluences at a time. It also depends on the situation in trading. Because sometimes, due to intense market conditions or confusion, you should add more confluences to increase the winning probability of a trade setup.
Importance
Confluence in the strategy will increase the winning probability and reduce the number of trade setups.
For example, you found 100 buy/sell trade setups within one month using the RSI indicator. Add the confluence of reversal candlestick patterns on the overbought and oversold regions. The number of trade setups will reduce from 100 to less than 50, and the winning probability will increase. Adding one more confluence will reduce the number of trade setups to less than 20. But it will be hard to find a trade setup. I recommend adding only one or two confluences simultaneously with any trading strategy.
How to add confluences to your trade setup?
It is straightforward, but adding confluence according to the type of strategy is essential. For example, if you are using the RSI strategy in which buy during oversold conditions and sell during overbought conditions are the rules. Then you should not use the supply and demand zones or key levels because the confluence of candlestick patterns will work the best here.
Like when the RSI line crosses the 70 level in an upward direction, this is a signal to open a sell trade. But if you wait for the bearish pin bar formation during the overbought region, both indicators (RSI and Candlestick pattern) give a sell signal. The latter is more trustworthy instead of using only the RSI indicator. In the same way, one should look for a bullish pin bar in an oversold region.
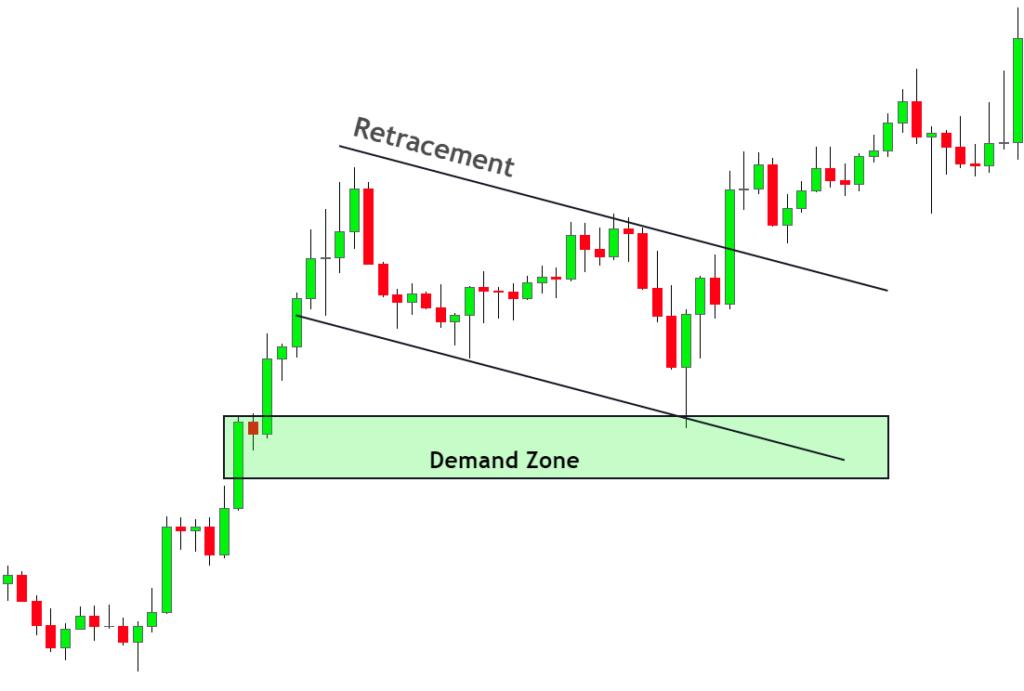
In another example, if you’re looking to buy after a retracement wave, you should add a confluence of demand zone or support zone instead of candlestick patterns.
That’s why adding confluence depends on the type of trading strategy.
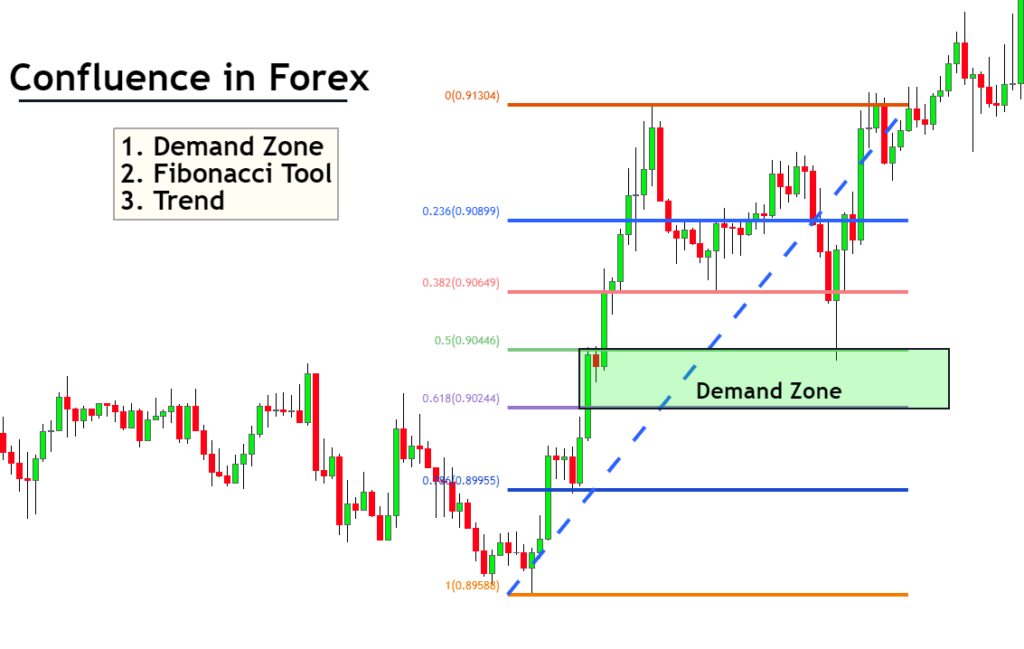
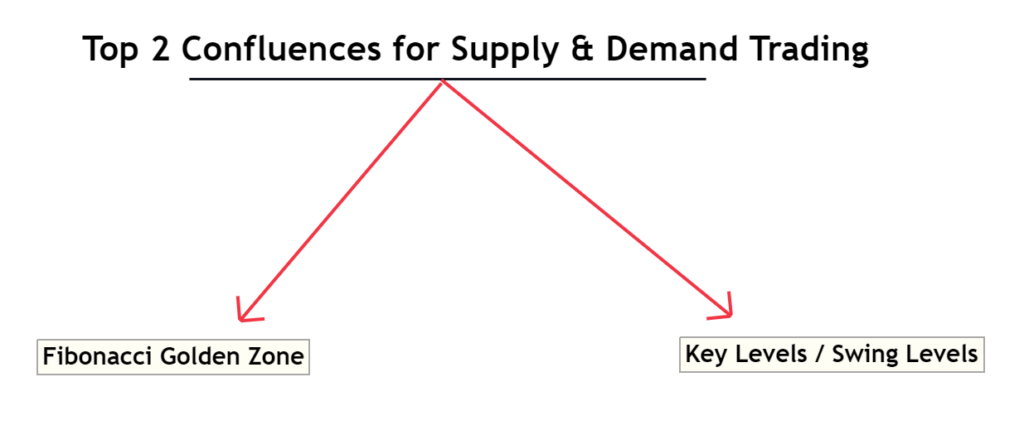
What type of confluences should you add with supply and demand zones?
At ForexBee, our primary focus is to teach supply and demand trading. I will show you the two best confluences to add with supply and demand zones to get a high probability zone.
The two confluences are as follows
- Fibonacci golden zone
- Key levels or ignored levels or round numbers
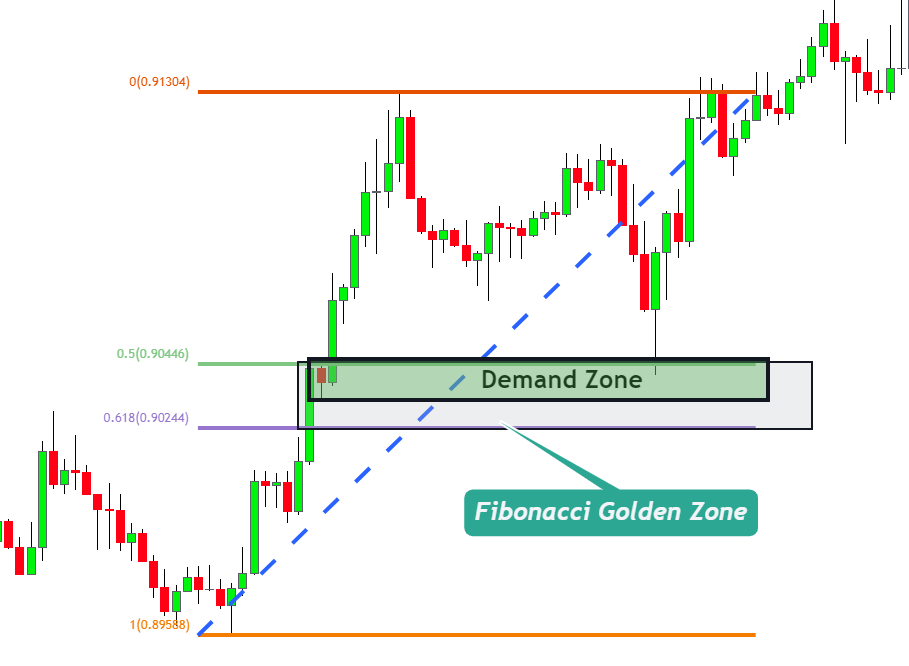
The confluence of the Fibonacci golden zone
Fibonacci golden zone has a price range between 50 to 61.8% Fibonacci levels. If you don’t know about this golden zone, then I will recommend reading the related article to get more detailed information about this.
When a supply/demand zone forms in the golden zone range of the Fibonacci tool, then the winning probability of this zone increases. Only valid S&D zones form within the 50 to 61.8% price range. This is a perfect confluence, and I mostly use this confluence for finding valid zones on the chart.
Look at the image below for a better understanding.
The confluence of key levels
Key levels are the price levels from where there are a lot of price rejections occur. So when a supply/demand zone forms at these levels, the probability of validation of the zone increases.
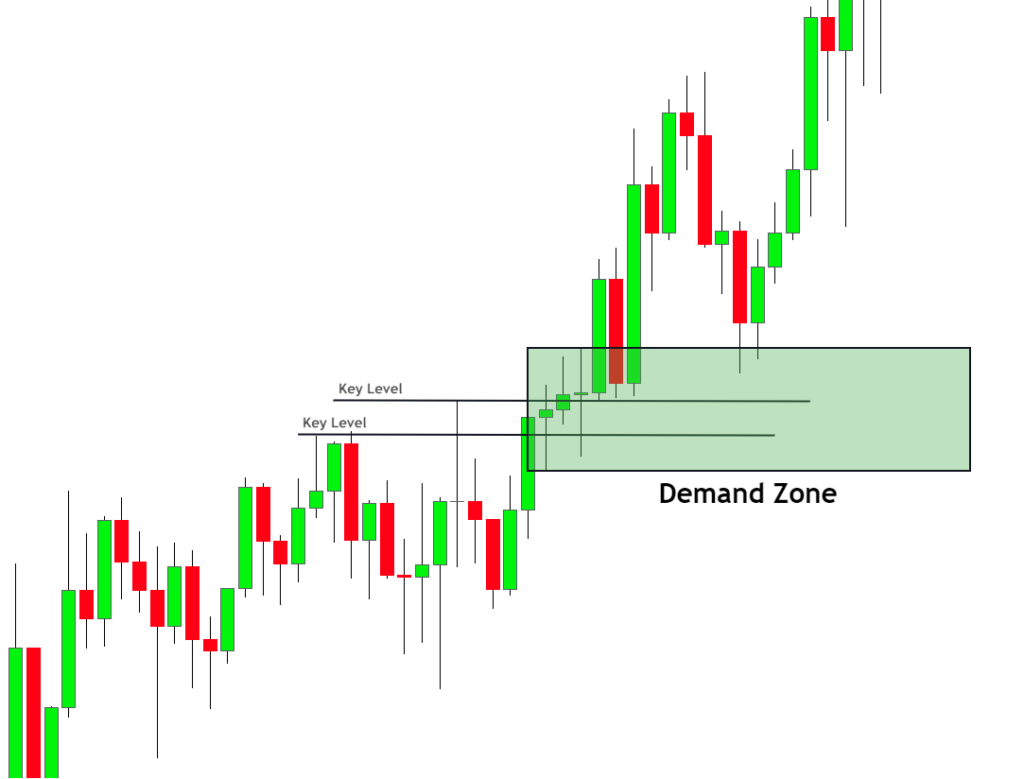
Mostly swing highs, and swing lows also act as key levels.
However, I will also recommend using the round price numbers and ignored levels to find good supply-demand zones.
Important point: you shouldn’t use the candlestick patterns and chart patterns as a confluence with supply and demand zones. Because these zones offer very high risk-reward ratios, the risk-reward ratio will decrease if you add candlestick patterns or chart patterns confluence.
The bottom line
If you want to build a solid and unique trading strategy, then confluence is the compulsory tool. Without confluence, I don’t think one will be able to increase the winning probability.
Now you should open the chart and backtest your strategy using confluences and determine which confluences work best for your strategy.