

Crab and Deep Crab harmonic pattern
Crab and deep crab are other types of harmonic patterns based on specific Fibonacci ratios that distinguished them from each other.
It is not a new pattern but it was discovered in 2001. As it is a natural chart pattern that uses the Fibonacci retracement and extensions. Due to its natural behavior, it’s also used widely nowadays. Natural patterns will continue to work and they will also work in the future.
Each harmonic pattern uses four to five particular Fibonacci ratios. If you master all the Harmonic patterns, it will be easy for you to detect a harmonic pattern on the price chart by just looking at the chart. The name of these patterns is not important, but Fibonacci ratios are important.
That’s Why you should focus on learning how Fibonacci ratios work in harmonic patterns? And why they are used?.
Pattern Types
Based on the direction of the price/market, crab and deep crab patterns are categorized into two types each.
- Bullish Crab Pattern
- Bearish Crab Pattern
- Bullish Deep Crab Pattern
- Bearish Deep Crab Pattern
How to recognize a Crab Pattern
It is a four-wave and five-point (XABCD) harmonic chart pattern that consists of a long CD wave. The long CD leg represents a sharp move that hunts the stop losses of retail traders and then reverses to the main direction.
Remember: A sharp move in the market after sideways or consolidation in the market is generally a trap.
Big traders or banks have the power to move the market. They don’t want you to profit. They uses a stop loss hunting technique by a sharp move in the market to eliminate the retail traders. So they can move the market in the original direction. Stop-loss hunting indication is given by CD leg.
Now let me explain to you the rules to identify the crab pattern in the market. Rules include the Fibonacci ratios used in the crab pattern.
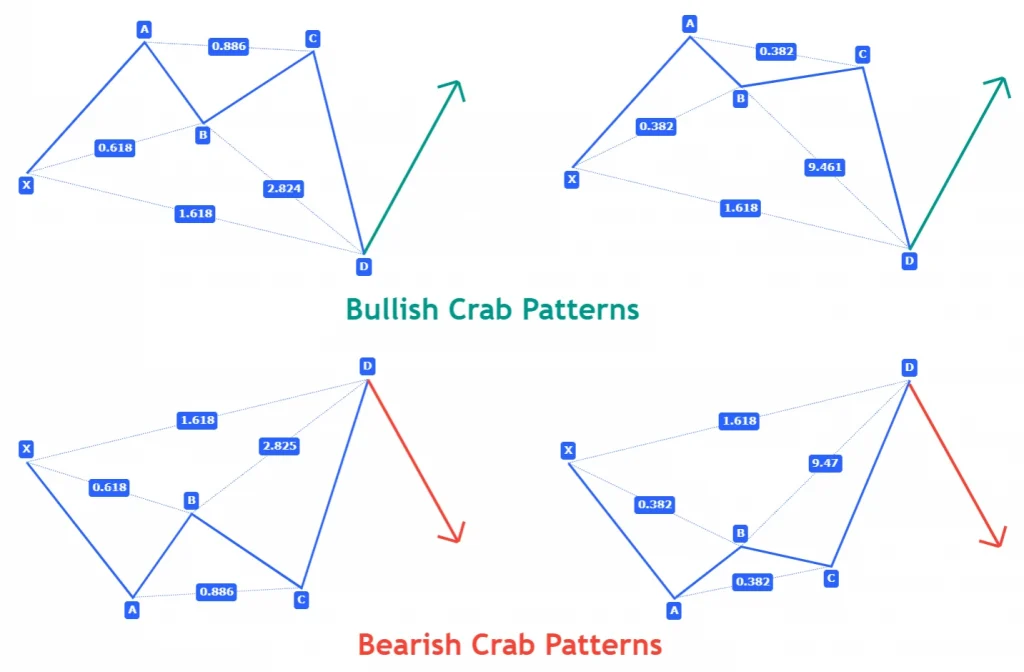
Bullish Crab Pattern
- It starts from point X and it extends to point A. Point X can be anywhere on the price chart but it is a good practice if you look for a bull pattern in oversold conditions
- Wave AB must retrace downward to 38.2-61.8 Fibonacci levels of XA wave
- Wave BC must retrace to 38.2-88.6 Fibonacci levels of AB wave
- The final wave CD is the longest wave and it must extends to 224-361 Fibonacci levels of BC wave.
Bearish Crab pattern
- It starts with point X and extends to point A. This pattern should form in overbought conditions.
- Wave AB must retrace upward to 38.2-61.8 Fibonacci levels of XA wave
- Wave BC must retrace to 38.2-88.6 Fibonacci levels of AB wave
- The ending wave CD must extends to 224-361 Fibonacci levels of BC wave
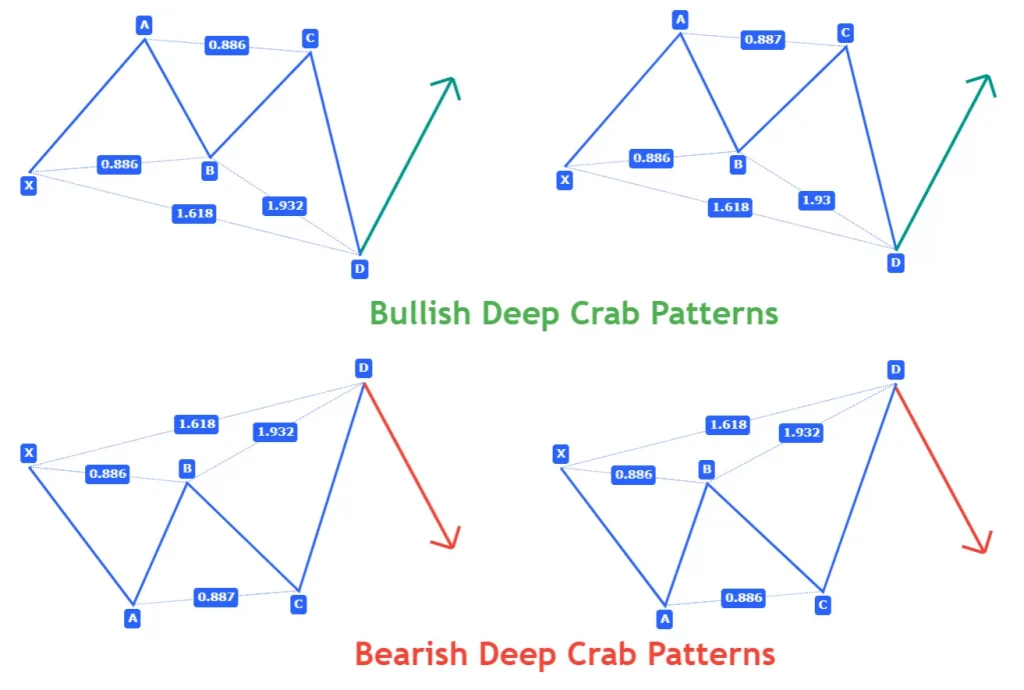
How to recognize Deep Crab pattern
It is a modification of a crab pattern based on deep retracement of waves. In this pattern, the retracements are always deep to 88.6 Fibonacci level. Extension levels will remain the same.
Bullish pattern
Follow the below criteria to identify a bullish deep crab pattern on the chart in technical analysis.
- XA is first wave of deep crab pattern and it must be a bullish wave
- AB must retrace to 88.6 fibonacci level of XA wave and it represents deep retracement
- BC wave must also retrace to 88.6 fibonacci level of AB wave.
- CD wave should extend to 161.8 fibonacci extension level of XA wave
Bearish pattern
In the bearish deep crab pattern, all the parameters will remain the same as in the bearish crab pattern except the retracement of AB and BC waves. Retracement must be to 88.6 Fibonacci level in case of deep crab
Difference between Crab and Deep Crab pattern
The addition of the word “Deep” with the Crab pattern tells traders about the unique feature of this pattern.
The major difference between both patterns is the percentage of retracement of waves. If retracement is deep like up to 88.6 Fibonacci level then it will be a Deep Crab pattern. On the other hand, if retracement is not deep like retracement up to 61.8 or 38.2 Fibonacci levels then it will be a Crab pattern.
This is the only major difference you will get in these patterns.
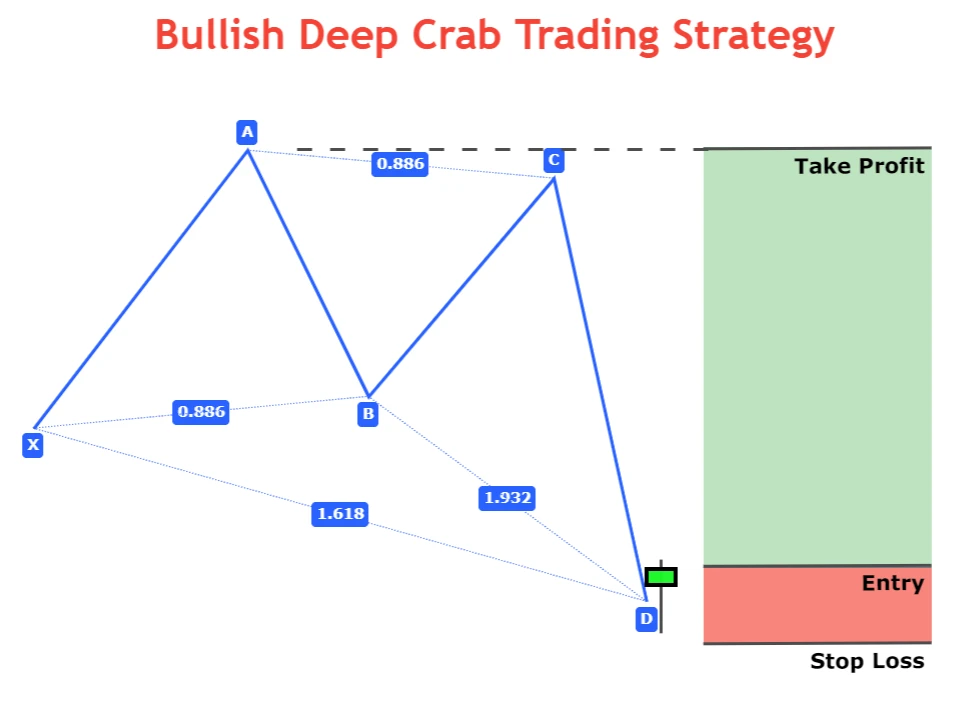
Crab and Deep Crab trading strategy
A trading strategy includes a detailed plan of an order opening criteria, take profit and stop loss. The first step to know in trading is to identify when to open an order and when to close a trade.
Open a Trade
After point D, we will always look for a confirmation to buy or sell a specific security. To open an order, a candlestick pattern is the best trade confirmation pattern.
After Point D, you will have to look for a bullish or bearish candlestick pattern. Candlestick pattern is considered as a confluence and it increases the probability of a trade setup.
Stop-loss
Stop-loss level is always below/above the candlestick pattern formation at point D.
Take-profit
Take profit level is the highest point in the case of a bullish pattern and it is the lowest point in the case of a bearish pattern.
For example, a bullish crab pattern forms in the EURUSD currency pair chart. Now you are looking to buy EURUSD. At point D in the Crab pattern, you should buy EURUSD but you will not get a valid price level to place a stop loss to protect your balance. Here candlestick patterns will help you.
You only need to find out a bullish candlestick pattern at point D and buy instantly. Place stop-loss a few pips below the candlestick pattern and take profit at the highest point of the bullish Crab pattern.
Conclusion
Harmonic Patterns are purely natural due to the influence of Fibonacci levels. They are widely used by retail traders and they work if used in a proper manner and risk management. Without managing risk, you will not be able to profit from trading.
Make sure to properly backtest these patterns (at least 75 times) before trading on live account