
Dead cat bounce is a continuation chart pattern that shows a slight price recovery in a falling market, but then the market continues the previous trend. It only shows a slight recovery in the market.
This chart pattern is widely used in crypto and the stock market. Most traders use this chart pattern for swing and position trading.
I will explain this chart pattern in detail in this article with trading psychology and strategy. So make sure to read the full article.
How to identify the dead cat bounce pattern?
To find this chart pattern, follow the following three steps.
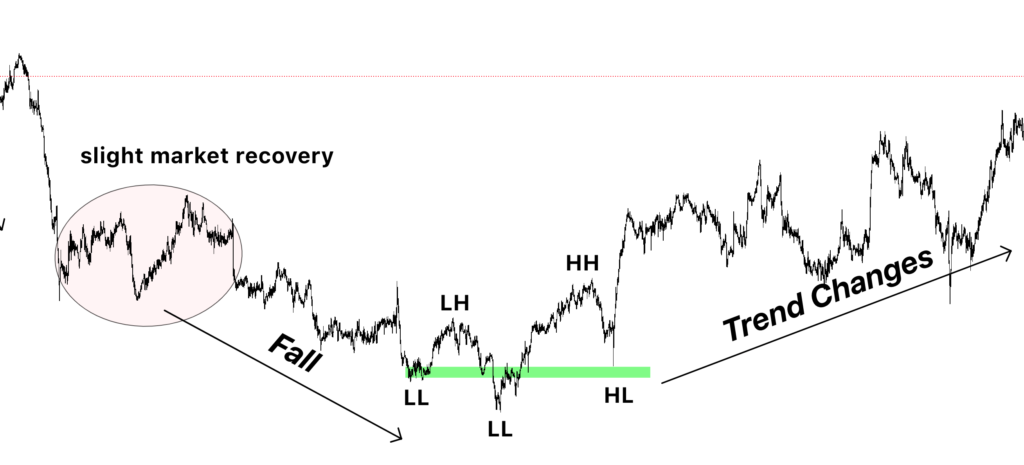
- First, identify the falling market. You will see big bearish candlesticks on the chart without any pause in market trends.
- After a big downfall, the market will try to recover, and a slightly bullish trend will start. You can see small bullish and bearish candlesticks forming a bullish trend.
- But after the minor bullish move, the market will continue the previous bearish trend again.
The trend continuation shows that the previous market recovery was a trap.
Look at the image below for a better understanding of this chart pattern.

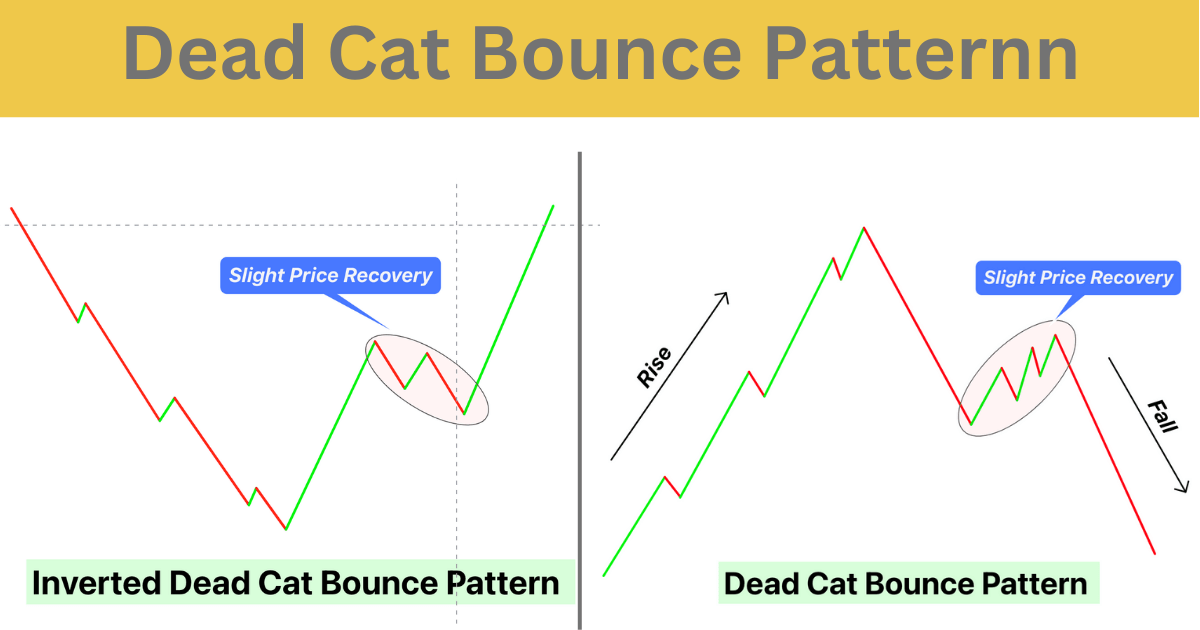
Types
This chart pattern has two types based on bullish and bearish trends.
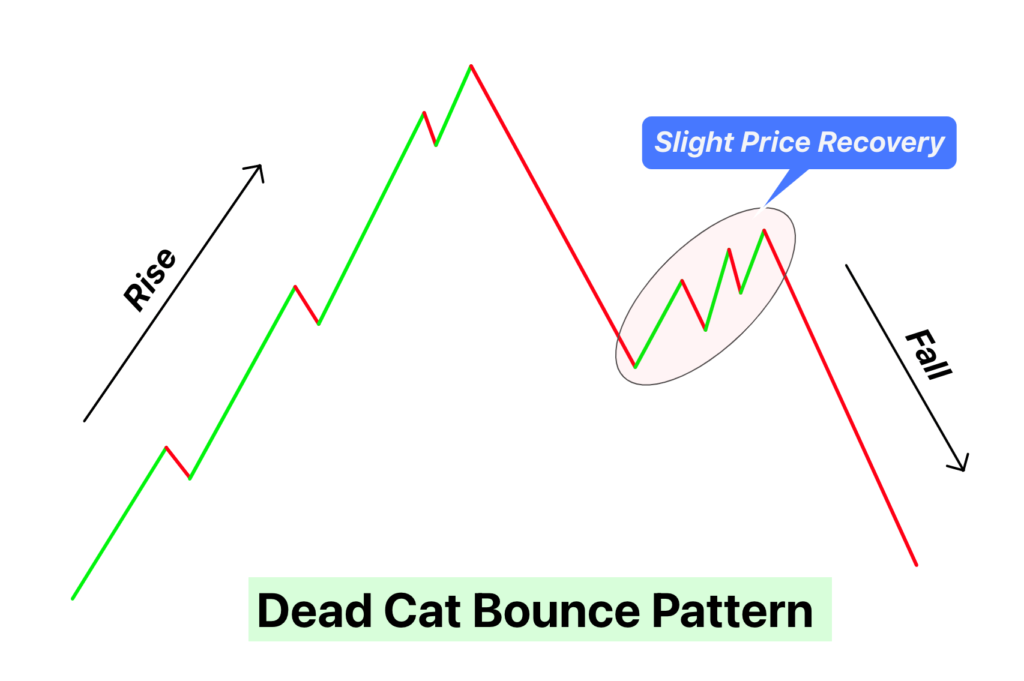
Dead cat bounce: If the market falls with a minor bullish bounce, the pattern will be a dead cat bounce.
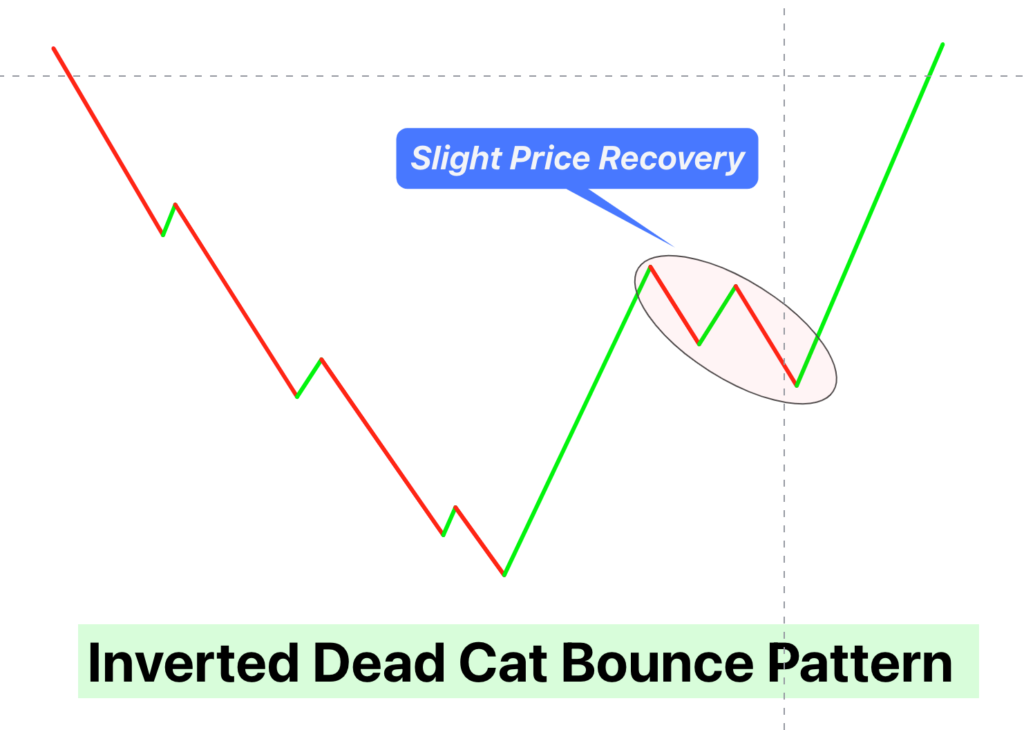
Inverted dead cat bounce: It is opposite to the dead cat bounce. In this pattern, the price will rise after a minor bearish pullback.
The psychology behind the dead cat bounce pattern
Big investors and institutions use this chart pattern to trap retail traders. Because of a minor bounce against the trend, investors know the market is about to turn. But actually, it was a type of trap by big traders.
Most retail traders buy from dead bounce, thinking it is a trend reversal.
But the big institutions buy once the price reaches the absolute market bottom.
You can also use this strategy as a retail trader by following the big institutions. For example, once a dead bounce pattern is complete, buy on forming a bullish chart pattern.
Let me explain to you in detail.
How to trade the dead cat bounce chart pattern?
Trading this chart pattern is not accessible due to many limitations. One of the significant limitations is that you can only find the dead cat bounce pattern once the pattern completes because there are also chances that a trend reversal occurs instead of a dead cat bounce. So direct trading this pattern as a trend continuation is a bit tricky. That’s why I do not recommend that retail traders trade this pattern directly.
However, I will explain another method to help you trade this pattern with the confluence of other technical tools.
As we know, market makers open their orders after trapping the retail traders. For example, during this pattern formation, market makers trap retail buyers. Then the price will keep falling, and most of the stop losses of buyers get hit. Then market makers enter and open buy orders to start a new trend.
We can take benefit from this analysis. For example, when pattern forms, you’ll have to look for bullish chart patterns like double bottom or triple bottom, or inverted head and shoulders patterns. After finding a bullish pattern, the probability of working on these patterns will be higher, along with a chance to get a high-risk-reward ratio trade setup.
But remember that the bullish patterns form after a complete dead cat bounce pattern.
Open a buy trade
After the formation of this pattern, look for a bullish chart pattern and open buy trade.
A dead cat bounce pattern completes when a bearish trend continues after a minor price recovery.
Open a sell trade
After forming the inverted dead cat pattern, look for a bearish chart pattern and open a sell trade.
The bottom line
The main thing is to learn the psychology behind the dead cat pattern. Psychology includes what the institutional traders think about the retail traders. When you understand the activity of market makers behind the chart, you can trade this pattern in several ways.
I will highly recommend you backtest this pattern at least 70 times to understand it completely.
Wow thanks alot bosses… I really learnt a lot