
Definition
Descending broadening wedge is a bullish trend reversal chart pattern that consists of an expanding wave in the downward trend. It is an indication of a long-term trend reversal in the market.
Retail traders widely use chart patterns to forecast the market. Because these are natural patterns, and symmetry in these patterns makes them unique.
In this article, you will learn the descending wedge pattern in complete detail with a trading strategy.
How to identify descending broadening wedge pattern?
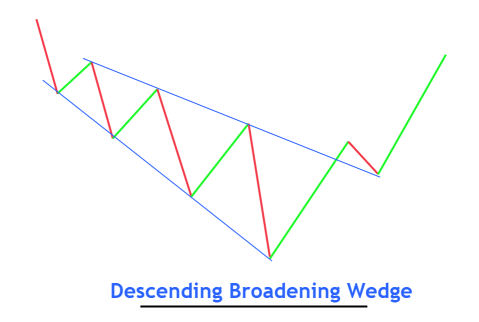
Descending broadening wedge is a type of wedge pattern. A wedge is a structure or pattern with one thick end and one thin end. In the case of descending broadening wedge, the starting point will be a narrow end, and the ending point will be a thick end because it shows the expansion of the price wave.
To find out this pattern on the chart, follow the following steps:
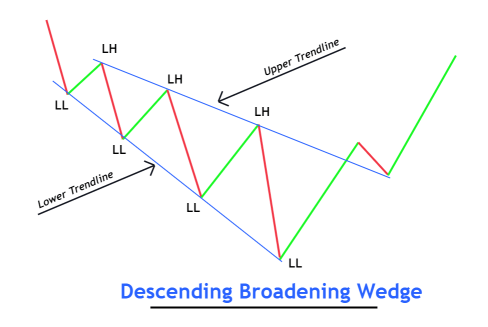
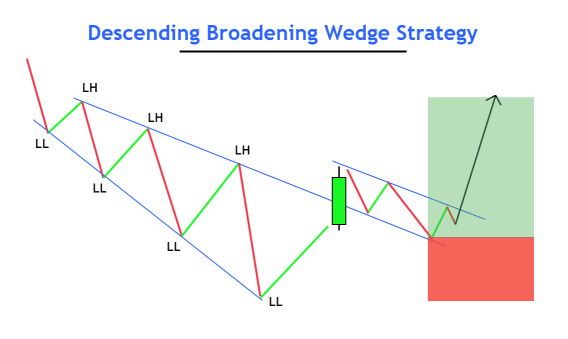
- Identify the starting point of the wave. The price wave should make lower lows and lower highs.
- Each upcoming wave should be greater in size than the previous wave.
- Draw two trendlines meeting the swing high and swing low points of waves.
- The starting point of this wedge pattern should be thin, and the ending point should be thick.
- There must be at least three waves in the descending wedge pattern.
These are the simple criteria to identify this pattern on the price chart.
Look at the image below for a better understanding.
What does the descending broadening wedge tell traders?
Price action trading is the best strategy to trade the market. But you can learn price action only with the screen time.
Price action is how price behaves from certain levels or during certain conditions like chart patterns.
Descending broadening wedge patterns can also be mastered by the price action technique because the currency chart will be full of false signals and trade ideas. You can also profit by filtering out the good trades from the crowd. And you can filter only when you have experience in trading this chart pattern.
Let me show you.
It is understood that institutional traders always capture the stop losses of retail traders. They will buy when you sell a currency or asset, and they will sell when you buy a currency or an asset.
So, when the price makes lower lows, and every upcoming wave will be greater than the previous wave, it is understood that the price will take a big decision. But before taking a decision, they will eliminate the retail traders. For example, the last wave of the descending broadening wedge pattern will be the greatest compared to previous ones.
Because the market has eliminated the retail traders by big price moves against their direction. And the price is already in oversold conditions because of consecutive lower lows. Now a bullish trend reversal will happen.
But before a bullish trend reversal, market makers will eliminate the retail buyers by giving false breakouts. So, it is also an indication of a trend reversal.
How to trade descending broadening wedge?
A Trading strategy consists of entry, stop loss, take profit level, and risk management techniques.
I will explain to you a simple method to trade this chart pattern. However, you can use other technical analyses with this strategy to increase winning.
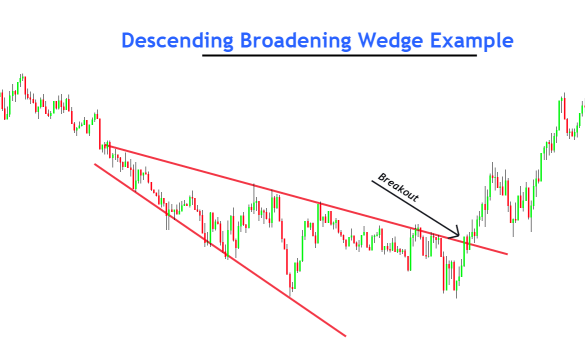
- Draw two trendlines meeting the highs and lows of waves. There must be at least three waves within the wedge pattern.
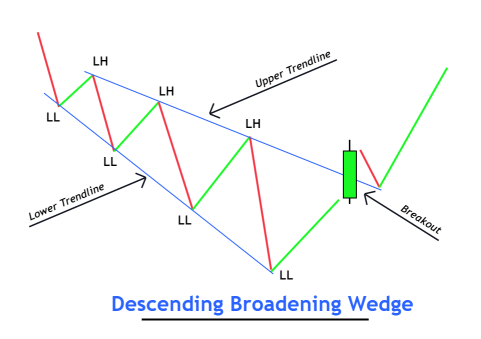
- Wait for the breakout of the upper trendline with a big candlestick.
- After the breakout, there are two scenarios. You can open a buy trade just after the breakout or wait for the price to retrace after a breakout to get a high-risk reward trade setup. The latter option is a bit conservative, but it is an excellent option to go with.
- Place stop-loss below the last lower low made by the price wave.
- Adjust the take profit level to the starting point of descending broadening wedge pattern.
This is a simple strategy to trade this chart pattern. However, you can also add other confluences like supply and demand indicator or key levels.
The Bottom Line
Chart patterns are the building blocks of technical analysis in trading. They forecast the price very accurately. But it is challenging to trade chart patterns like descending broadening wedge patterns alone. But with the confluence of other technical tools, you can make a profitable trading strategy.
Make sure to backtest the chart pattern properly before using it in live trading.