
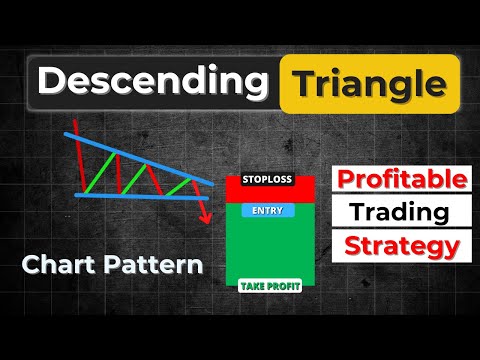
Descending Triangle Pattern
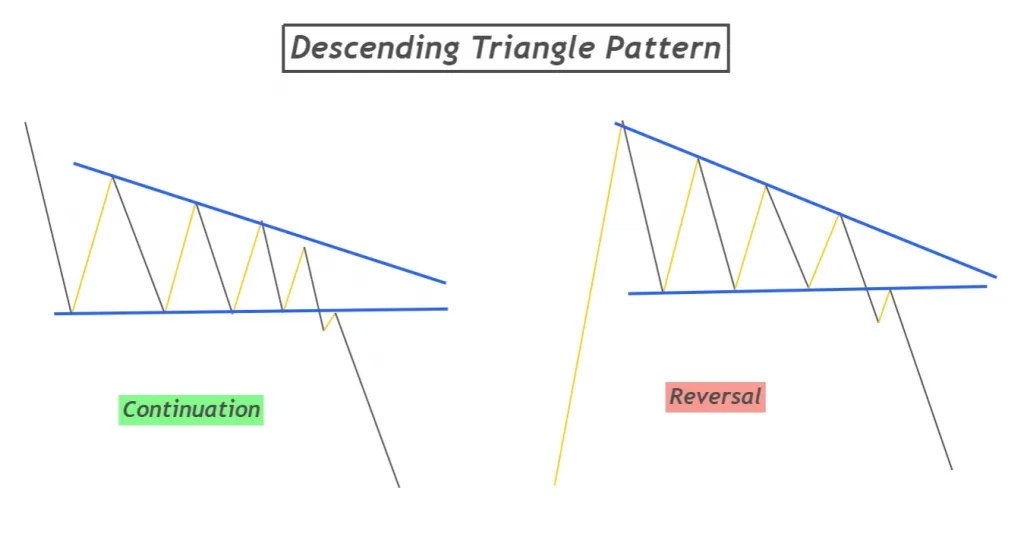
The descending triangle refers to a reversal/continuation chart pattern in which price forms a pattern that resembles the shape of a triangle. Reversal and continuation depend on the location of descending chart pattern.
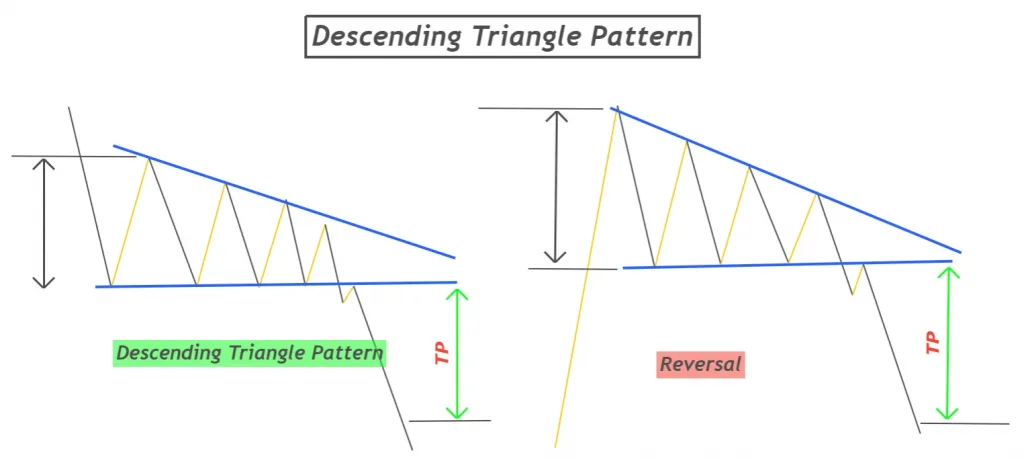
- If it forms in the mid of downtrend, then it will act as trend continuation
- It will act as trend reversal if it forms at the top of uptrend
These are two important forms of this chart pattern that helps to identify trend reversal or trend continuation.
How to find out descending triangle pattern?
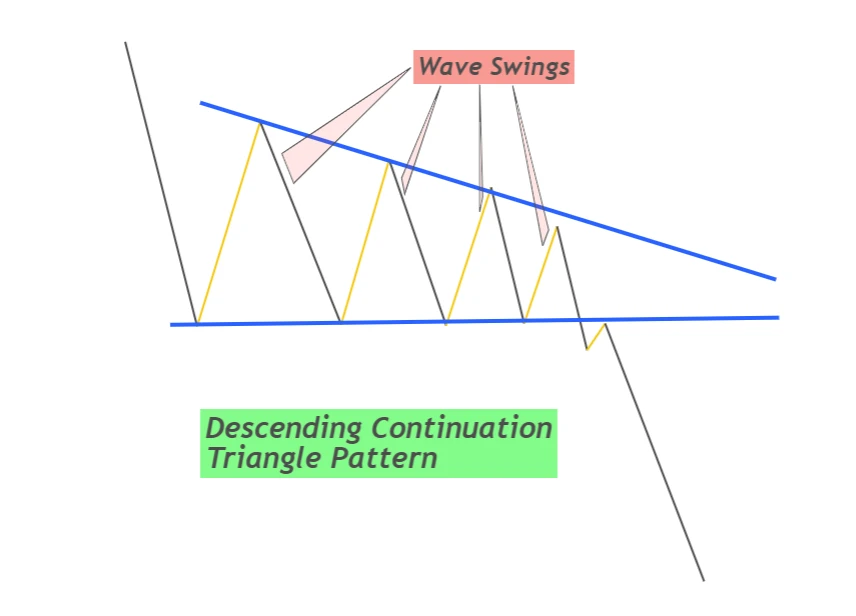
When price forms at least two swing waves with the same bottom zone and slopping downward. Each next wave will be smaller in size as compared to the previous wave.
Draw a bottom zone connecting the lows of swings and a trendline connecting the highs of swings. This pattern will form the shape of a triangle.
Points to remember
- The swing waves must be clear, and you should avoid choppy market
- High of each wave must be lower than the high of previous wave. A Descending trendline will form.
- There must be at least two swing waves that are necessary to form a triangle pattern
How descending triangle pattern works?
Descending triangle pattern works in two ways either a continuation or a reversal pattern.
Continuation chart pattern
When descending triangle patterns forms during the downtrend, then it will act as a trend continuation.
It will give rise to a strong support zone that holds the price up. Price wants to go down but due to the strong support level, the price keeps on bouncing on the zone to weaken this price level. Then price breaks the support zone and continues its downtrend by an impulsive wave.
Reversal chart pattern
The formation of this pattern at the top of uptrend gives rise to a reversal in the price trend.
It tell traders that the price wants to come down. Repeated small swing waves show that price is weakening support level and after support zone breakout it will start a new bearish trend in the price of a security.
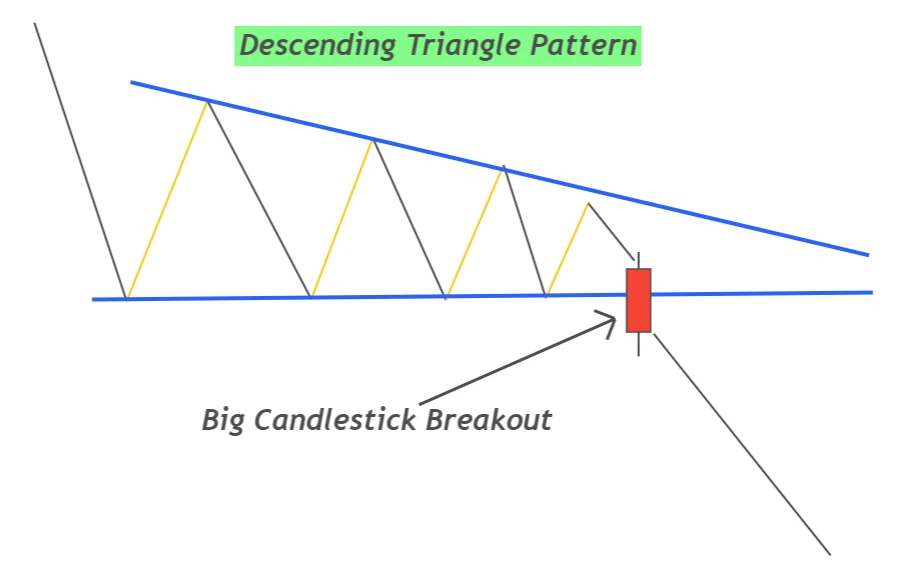
Identify a valid breakout in descending triangle pattern
A false breakout is the most widely used tool that market makers use to stop loss hunting. That’s why it is not easy to trade in the real market. There is too much cowed in the market. If you want to be a winner, you must follow unique methods.
To avoid false breakout in the descending triangle pattern, look for a big bearish candlestick breaching through the support zone. You must avoid support zone breakout by a Doji candlestick or a small candlestick. Because Doji does not indicate a breakout, but it indicates the indecision phase.
For simplicity, body to wick ratio of the big breakout candlestick must be more than 70%.
When descending triangle pattern works best?
It works best during trading with the trend. As it can be sued as a reversal or continuation chart pattern, I will recommend you use it for a continuation chart pattern for a higher winning ratio.
Trading with trends eliminates a lot of hurdles from the way.
If you want to use it as a reversal chart pattern, then make sure the overbought conditions of price. when the price is overbought, then there are more chances of reversal. It will mostly give a false breakout in the case of using it as a reversal chart pattern.
Descending triangle pattern trading strategy
Trading descending triangle pattern is very easy but spotting this on the chart of currency pairs daily is difficult.
Before discussing trading strategy, let me explain to you the important levels for stop loss and take profit order placement.
How to measure take profit in descending triangle?
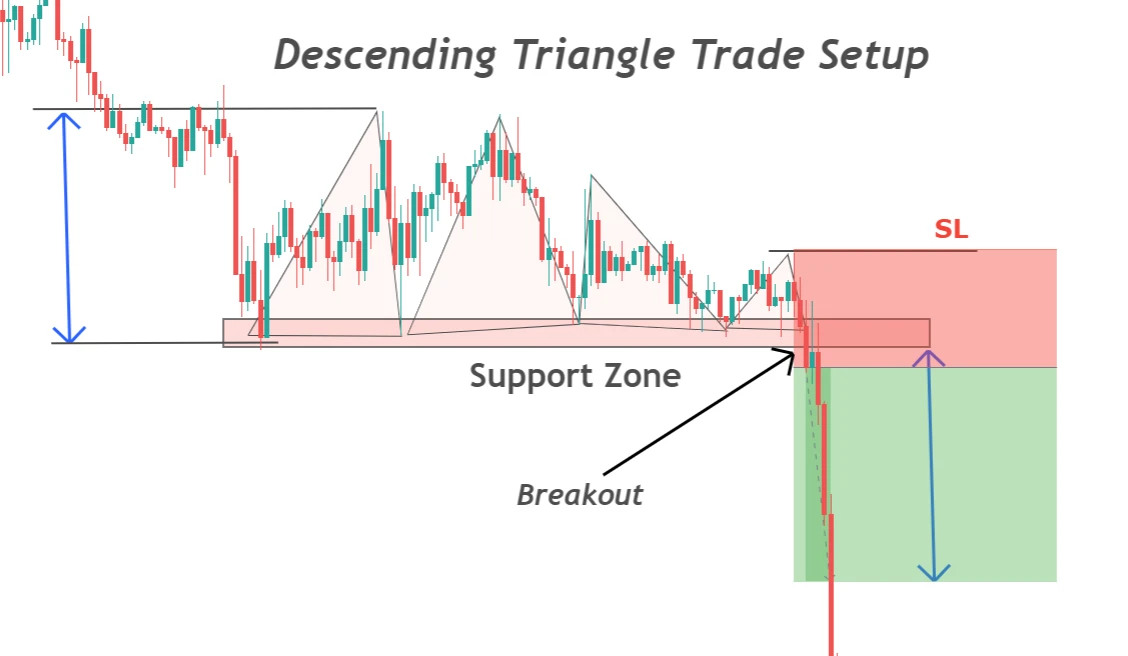
Take profit level in descending triangle pattern is measured by projecting the maximum height of pattern from support zone. The height of the pattern represents the number of pips. If the height of descending pattern from the support zone is 60 pips, then the take profit level will be 60 pips away from the support zone.
Where to place stop loss order?
After the support zone breakout and opening order, the stop loss will be placed above the high of the last swing wave. For example, if there are a total of three swings in the descending triangle pattern then stop loss will be placed above the high of the third swing wave.
Look in the below image for a better understanding of the concept.
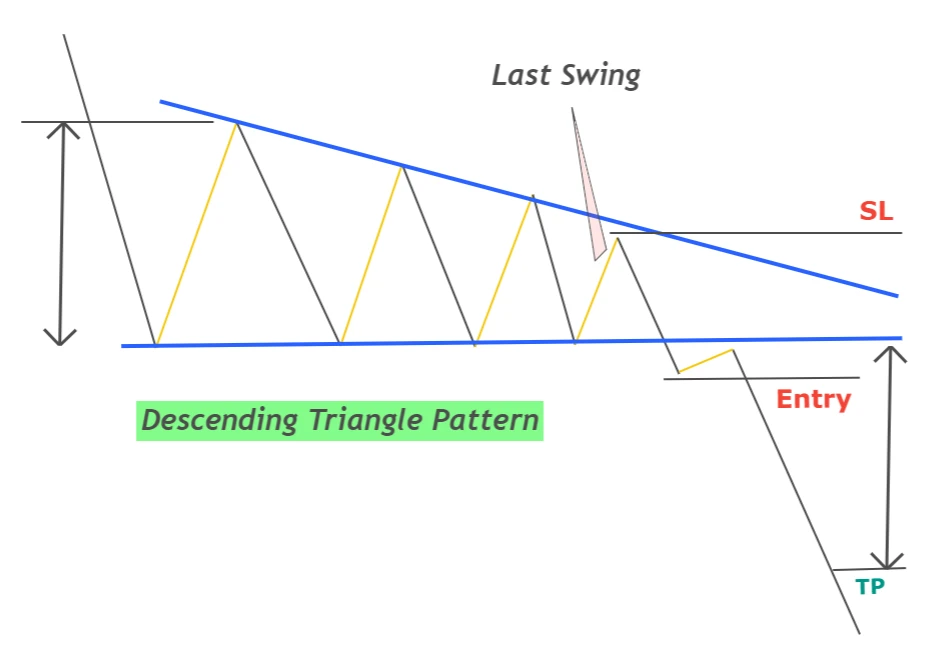
When to open order?
After the support zone breakout, the price gives a retest of the support zone. If we wait for price retest after the breakout of support, then it will give a better risk-reward ratio. But by following this method, we will miss many patterns because price does not give a retest always.
That’s why place a sell order just after breakout confirmation and put stop loss above the high of the last swing wave.

Conclusion
Descending triangle pattern represents the natural behaviour of the market. It has a high winning probability due to natural behaviour if traded with proper confluences. Never miss this trade opportunity and try to backtest this pattern before trading on a real account.
It is important to invest your time in learning before trading.
FAQs
Descending the triangle pattern is always bearish. It does not matter whether to use it as a reversal or continuation pattern. It will always predict the bearish trend.
Descending triangle pattern always breaks down or support zone. if it breaks up it means it is a false breakout. it is a bearish pattern
there are two more types of descending triangle patterns.
Symmetrical triangle
Ascending triangle