
What is Divergence in trading?
Divergence in trading refers to the deviation of price and oscillator from a path. It means price and oscillator will move in the opposite direction.
The Oscillator must follow the path of price because it uses the price to calculate its value. It must move up when the price is heading upward, and the oscillator must move down when the price is also in the downtrend.
But at some points in trading, the Oscillator diverges from its path. For example, if the price is in a bullish trend, then the oscillator will move down and vice versa. This indicates divergence in the oscillator, and it is a leading indicator in trading.

Types of Divergence in Trading
There are four main types of divergence in trading
- Bullish divergence
- Bearish divergence
- Hidden bullish divergence
- Hidden bearish divergence
Bullish divergence
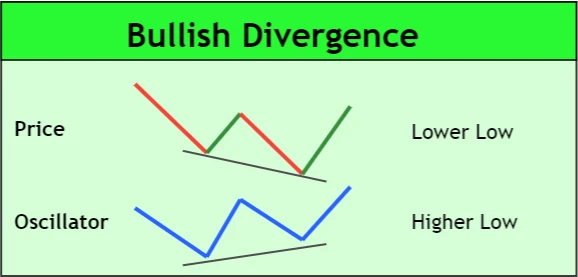
The formation of lower lows in the price and higher lows in the oscillator is called bullish divergence. This type of divergence of the oscillator will reverse the price from a bearish trend into a bullish trend.
Bullish divergence is an indication of a trend reversal.
Bearish divergence
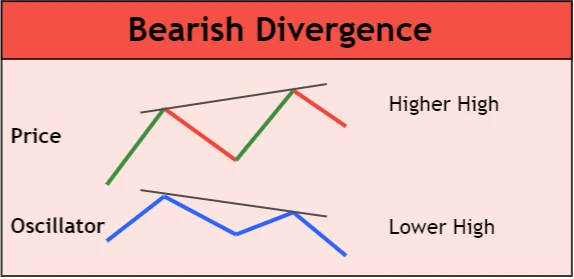
The formation of higher highs in the price and lower highs in the oscillator is called bearish divergence. It means that buyers are weakening, and sellers are preparing to enter the market. It will cause the price to reverse trend from bullish into bearish.
Bearish divergence is a sign of trend reversal
Hidden bullish divergence
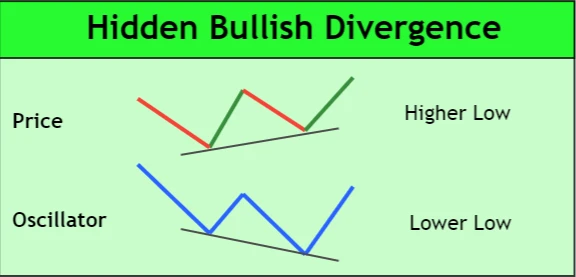
If the oscillator forms a lower low but the price forms a higher low on the chart, then this type of divergence is called hidden bullish divergence.
It indicates buyers are becoming stronger and the previous bullish trend will continue.
Hidden bullish divergence is a sign of trend continuation
Hidden bearish divergence
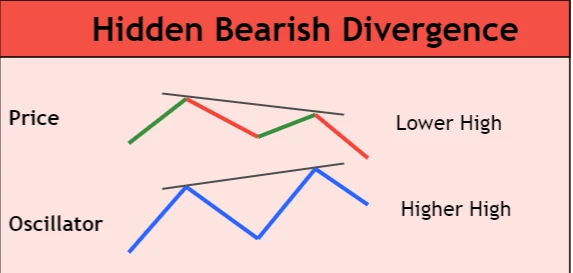
If the oscillator forms a higher high and the price forms a lower high, then this type of divergence is called hidden bearish divergence.
It will cause the bearish trend to continue because of more sellers returning to the market.
Hidden bearish divergence is an indication of trend continuation.
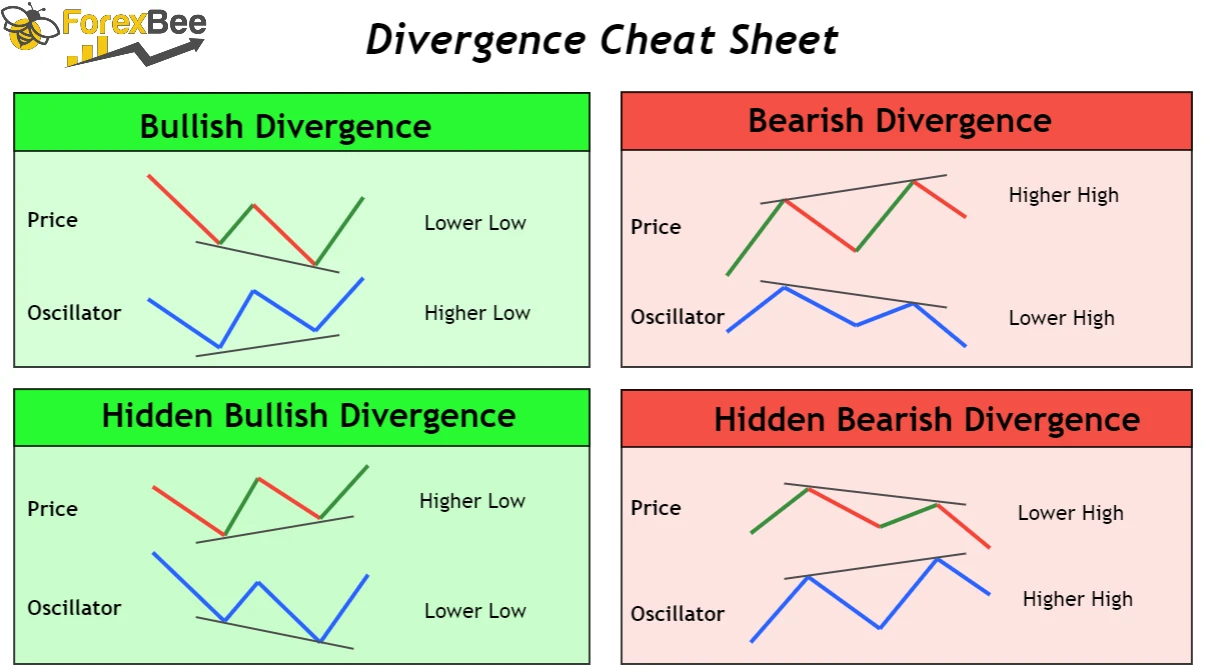
Divergence Cheat Sheet Table
| Type | Price | Oscillator | Trend |
|---|---|---|---|
| Bullish Divergence | Lower Low | Higher Low | Bearish into Bullish |
| Bearish Divergence | Higher High | Lower High | Bullish into Bearish |
| Hidden Bullish Divergence | Higher Low | Lower Low | Bullish Trend Continuation |
| Hidden Bearish Divergence | Lower High | Higher High | Bearish Trend Continuation |
Why should you use RSI oscillator for Divergence?
Divergence is always shown by an oscillator used in technical analysis. Relative strength index (RSI) is the most popular oscillator that is used to identify divergence in trading.
There are other oscillators too that can be used to determine divergence, but RSI is the best because of the following few characteristics.
- Divergence in RSI is easy to spot because of a single line with 14 period historical data.
- Finding out overbought and oversold price will make this oscillator more accurate for divergence. Because if there is bullish divergence in oversold condition, then there are higher chances of trend reversal.
- 30 and 70 level in RSI make it easy to recognize divergence in Oversold and Overbought price.
Summary
The divergence cheat sheet includes are the four types of oscillator divergence in trading. I Recommend you use hidden divergence because it signals you to trade with the trend only.
The survival in trading is by trading with trends (with big banks and institutional traders).