
Definition
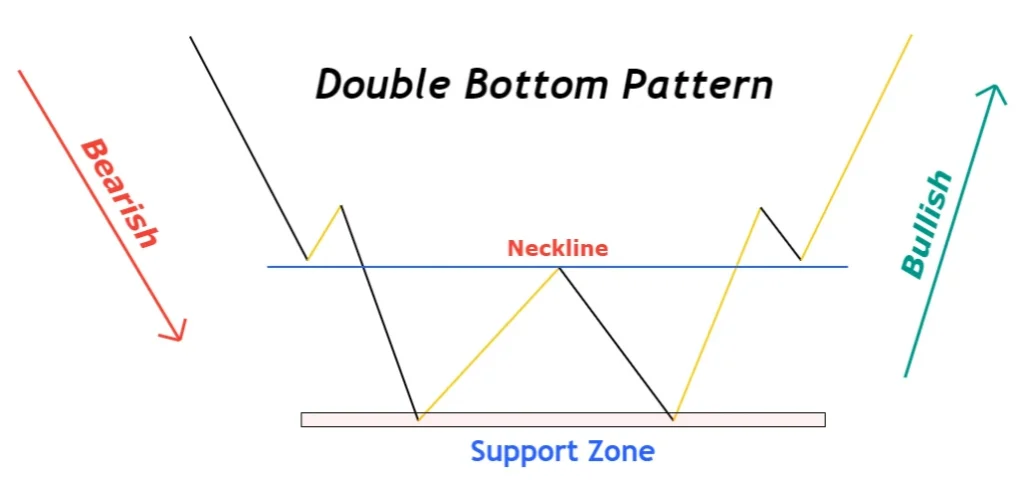
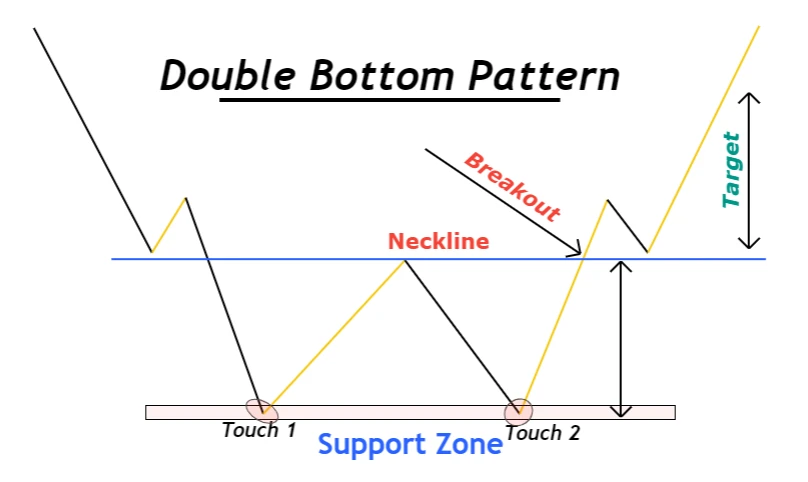
Double bottom is a bullish reversal chart pattern in trading that indicates the formation of two price bottoms at the support zone. It is also known as W Pattern because this pattern resembles the shape of the alphabet “W”.
In technical analysis, retail traders use a double bottom chart pattern to predict the reversal of the bearish trend into a bullish trend. It is also widely used in technical analysis.
How to identify double bottom pattern
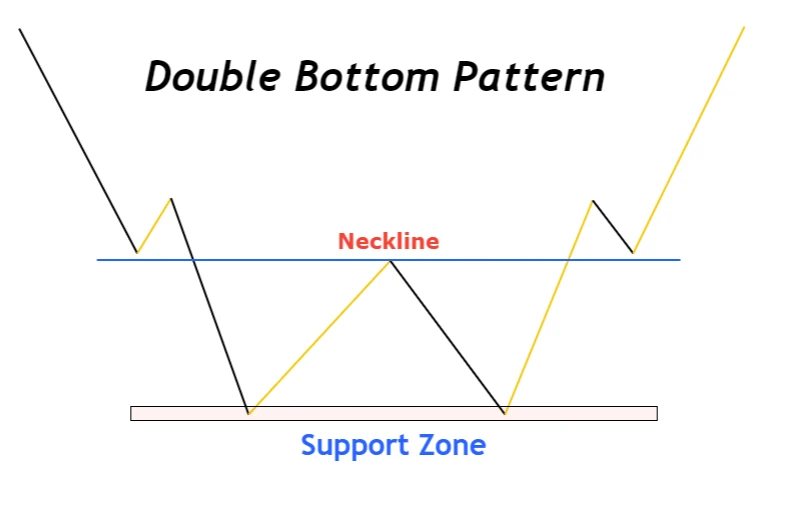
At the support zone, the price bounces because of buyers buying from the support zone. When the price bounces a second time from the zone, breaks the last lower high and neckline breakout, then a double bottom pattern forms on the chart. It causes the trend reversal.
To identify the double bottom pattern on the chart follow the following steps
- There must be a small bearish trend before the w pattern formation. This is a compulsory step because a double bottom pattern with oversold conditions has high probability of winning in trading.
- Draw a support zone meeting the two touches of price
- Mirror that support zone to the high of the swing wave that made double bottom pattern
How to draw neckline in double bottom pattern?
On the chart, price always moves forward in the form of swing waves. In the W Pattern, the high point of the swing wave acts as a Resistance zone and the low point of the swing wave acts as a support zone. The resistance zone that is the main hindrance on the way of buyers is also known as a neckline of the pattern. Bec after neckline breakout, it is confirmed that the trend has been reversed.
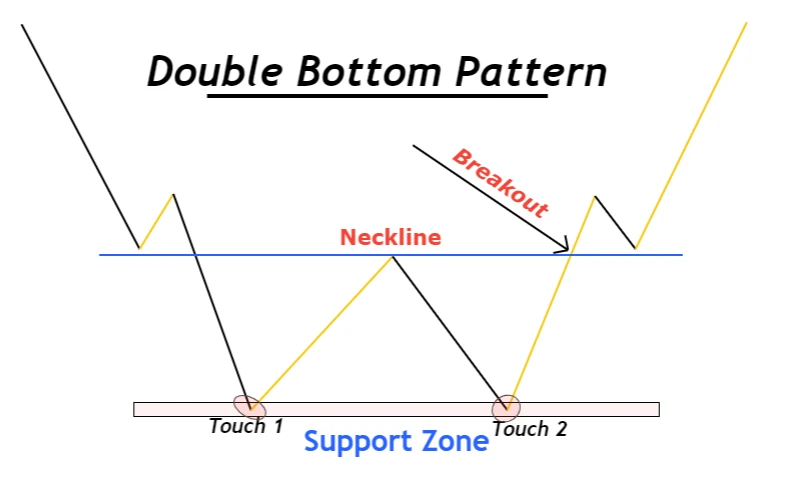
A valid neckline breakout
Market makers always try to deceive retail traders by many false breakouts of such chart patterns. Therefore, it is necessary to identify a valid breakout instead of becoming prey to market makers.
To detect a valid breakout, look for a big bullish candlestick breaching through the neckline. Breakout with a small body candlestick, like a Doji candlestick, indicates a false. The big bullish candlestick represents huge momentum of buyers and it happens only at key areas on the candlestick chart.
What does W pattern tell retail traders?
A chart pattern is a natural pattern that repeats after irregular intervals of time. There is a logic behind every pattern formation on the chart. If you will read the price by price action then you will come to know the logic behind every pattern. Price reading will make you capable of finding good chart patterns to trade.
In the double bottom pattern, two zones are formed.
- Support zone where there are more buyers than sellers
- Resistance or neckline where there are more sellers than buyers
If the sellers break the support zone then it means the potential of selling is greater and it will keep the price moving downward. On the other hand, if buyers break the resistance zone then it means the sentiment of buying a currency is greater.
PRO TIP: Neckline breakout represents the breakdown of the potential of sellers in the market on a certain timeframe
So in a double bottom pattern, after two bounces from the support zone, the price breaks the resistance or neckline and reverses the bearish trend. Two bounces are to weaken the potential of sellers.
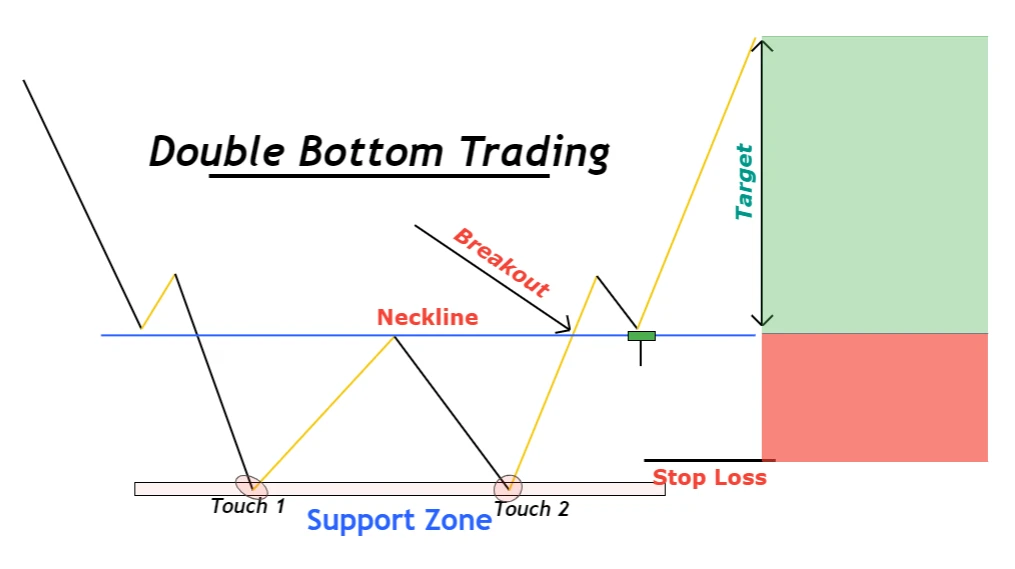
Double bottom trading plan
The last step of trading this chart pattern is to make a trading plan for trading.
Open a Buy Order
After neckline breakout, open a buy order instantly. You should wait for a valid neckline breakout.
Stop-loss in double bottom pattern
Place stop loss a few pips below the lower low of the double bottom chart pattern.
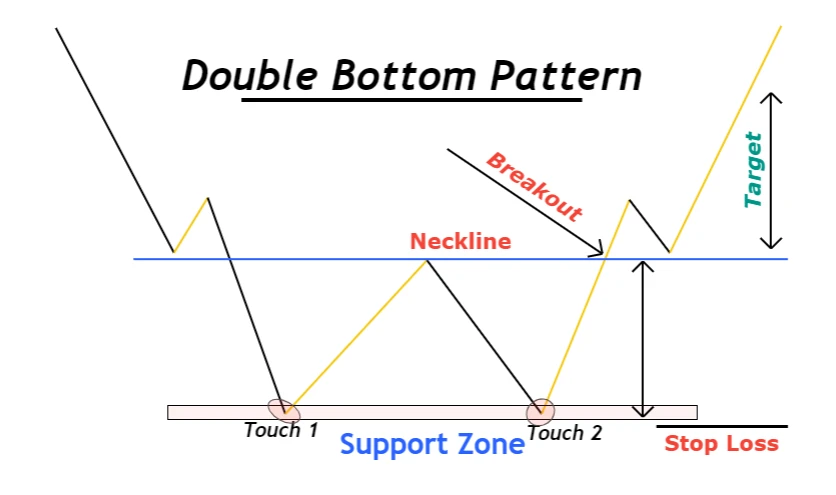
Take-profit
The take-profit level is measured by calculating the number of pips between the support zone and neckline.
Risk management
The ideal risk size you should take while opening order is 2% of your total account balance. You should not open a trader if the risk-reward ratio is less than 1:2
Double top pattern trading strategy
The trading strategy is different from a simple trading chart pattern. Chart patterns are used by a lot of retail traders. So you win in trading you need to be unique from others.
What you can do to become unique?
You can add confluences to make a strategy powerful.
Like in the double top strategy, we have added three confluences
- Higher timeframe trend
- Candlestick pattern
- Oversold conditions
Trading strategy
- Check out the higher timeframe trend. The higher timeframe trend must be bullish.
- Analyze the oversold conditions using RSI technical indicator or using price action.
- Confirm a valid neckline breakout. Breakout must be with a big bullish candlestick on the chart.
- Open a buy order instantly or wait for the price to retrace downward. It depends on the risk-reward ratio. If the risk-reward ratio is already good then open trade instantly otherwise wait for a retracement.
- The Stop-loss level is placed below the 78.6% Fibonacci level
- Take profit level is increased by multiplying TP1 with 1.618. 1.618 is a Fibonacci number.
Conclusion
In trading, chart patterns reflect the actions of nature. Instead of relying on mathematical formula-based indicators, your main focus should be on chart patterns. You can use indicators with chart patterns to increase efficiency. This is the best way, a retail trader can use indicators in strategy.
Make sure to backtest the strategy properly before trading on a live trading account.