
What is Drop Base Rally in Trading?
Drop base rally (DBR) is a price pattern that represents the formation of a demand zone on the price chart in technical analysis. Market makers open buy orders from demand zones to go long in trading.
It is a type of supply and demand in technical analysis and known as DBR. These patterns are the basics of supply and demand. You can not master SnD trading without mastering these basic patterns correctly.
How to identify Drop base rally?
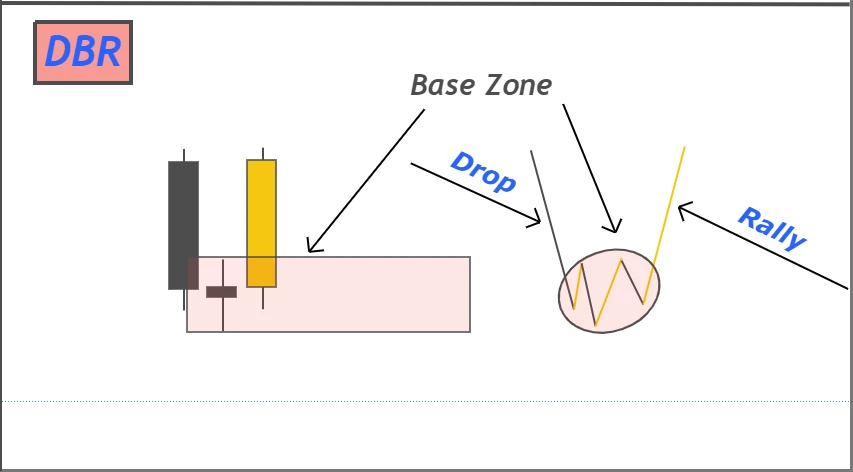
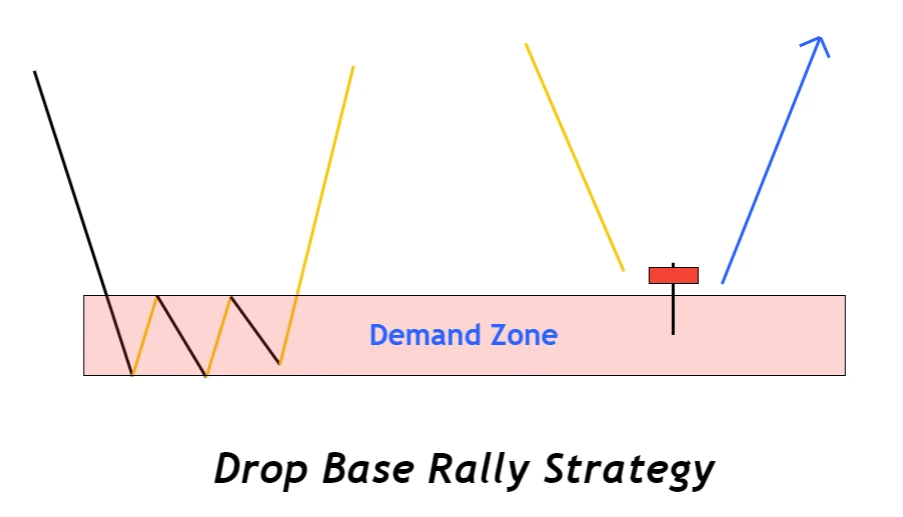
As the name suggests first drop, second base, and then third rally. It means DBR consists of three waves.
- Bearish impulsive wave (Drop)
- Sideways retracement wave (Base)
- Bullish impulsive wave (Rally)
When these three waves form in the above order on the chart, then it means a drop base rally pattern has been formed.
If you analyze a higher timeframe candlestick that has a larger body and small wicks on a lower timeframe, then you will see a complete impulsive wave on the lower timeframe. By analyzing higher timeframe base candlestick, you will see a sideways market wave on the lower timeframe.
From the above results, instead of analyzing a wave which is a difficult part, you should analyze candlesticks. Follow the following formula to identify a demand zone on the chart.
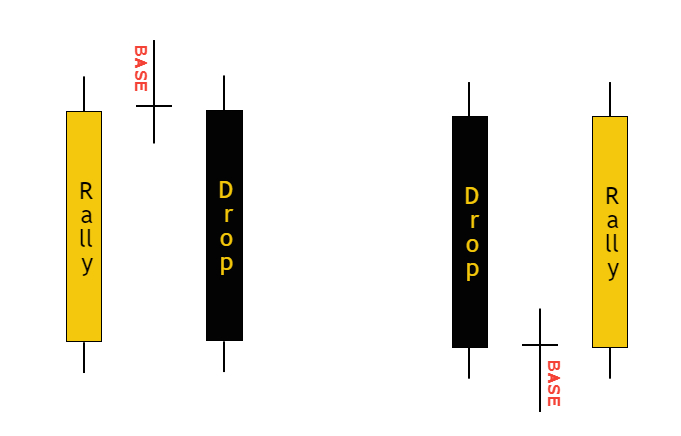
DBR = Big bearish candlestick + Base candlestick + Big bullish candlestick
Criteria for candlesticks
All the big candlesticks do not represent an impulsive wave. That’s why you should follow strict guidelines.
- The body to wick ratio of big candlestick must be greater than 70%
- Base candlestick must have body to wick ratio less than 25%
When you will follow the above two rules, then you will identify a correct drop base rally pattern
How to draw demand zone in DBR?
The base zone is directly proportional to the demand zone in the drop base rally pattern. Draw a rectangle by using high and low base candlestick and extend it to right.
The base candlesticks can be more than 1. But you should always take the highest high and lowest low of base candlesticks to draw a demand zone.
Remember big candlesticks will always remain two but base candlesticks can be more than 1.
What does DBR pattern tell traders?
In trading, you always look for the areas on the price chart that is under the consideration of big traders/market makers. Because you want to trade with institutions and trends created by market makers.
Supply and demand patterns help us to find those high probability zones. DBR pattern creates a zone that shows the demand to retail traders on the chart. Demand zone means more buyers want to buy from that zone. Because market always move from one zone to another zone in technical analysis
How to trade Drop base rally pattern?
Likewise in the other three supply & demand patterns, there are also two methods to trade a DBR pattern.
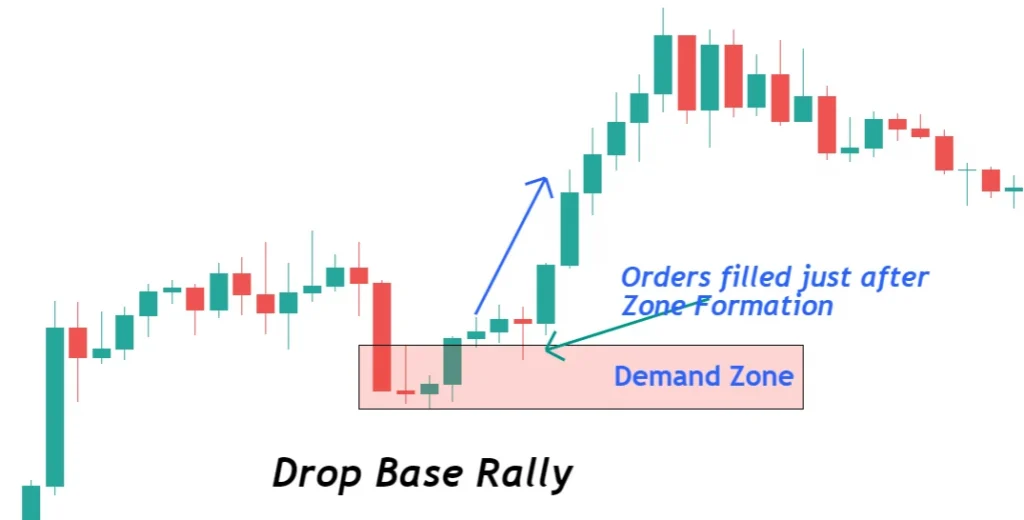
In Method 1, the price will pick pending buy orders of traders by touching the demand zone just after the formation of the DBR pattern on the chart. It is the best method because the price takes a minimum time to return to the zone.
In Method 2, the price will take time to return to the demand zone. It means it will return to the demand zone after a full swing wave or more than one wave.
- A demand zone will be weak if price will take more time to return to zone
- A demand zone will be strong if price will take minimum time to return to zone
To trade with the second method, you should add a confluence of bullish candlestick patterns at the zone. It means when the price will return to the zone then you should wait until the price forms a bullish candlestick pattern (bullish pin bar) at the zone.
This step will filter out bad trades from the crowd.
Bottom Line
You should always trade with logic and try to improve that logic by analyzing the history and reading the price on a candlestick chart. Supply-demand is the best and the first method of trading by technical analysis. You should master it before learning anything else.
Very nice article. Being a beginner I find it very detailed.
Thank you So much.
The article is very detailed
Does the DnS indicator work on Thinkorswim platform?