
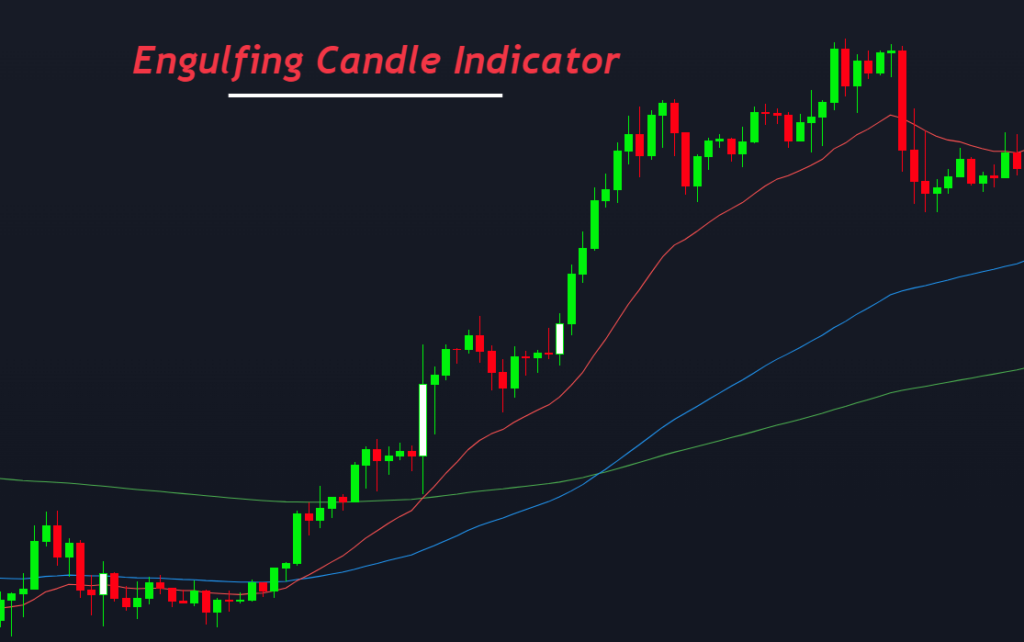
Definition
Engulfing candle indicator is a technical indicator that identifies real-time engulfing candlestick patterns on the price chart. This candlestick pattern is one of the best trend reversal candlestick pattern in technical analysis.
The indicator will highlight the bullish or bearish engulfing candlestick. The best feature of this indicator is that it will also plot the three moving average lines that show the price trend. So you can trade in the direction of the major trend.
In this article, you will learn to trade with engulfing candlestick indicator, and at the end of the article, you will get a link to access this indicator for free.
How does the engulfing candle indicator work?
Before learning the working of this indicator, you should be able to identify the engulfing candlestick on the chart correctly. Let me explain the engulfing candlestick. You can also learn in detail by visiting here.
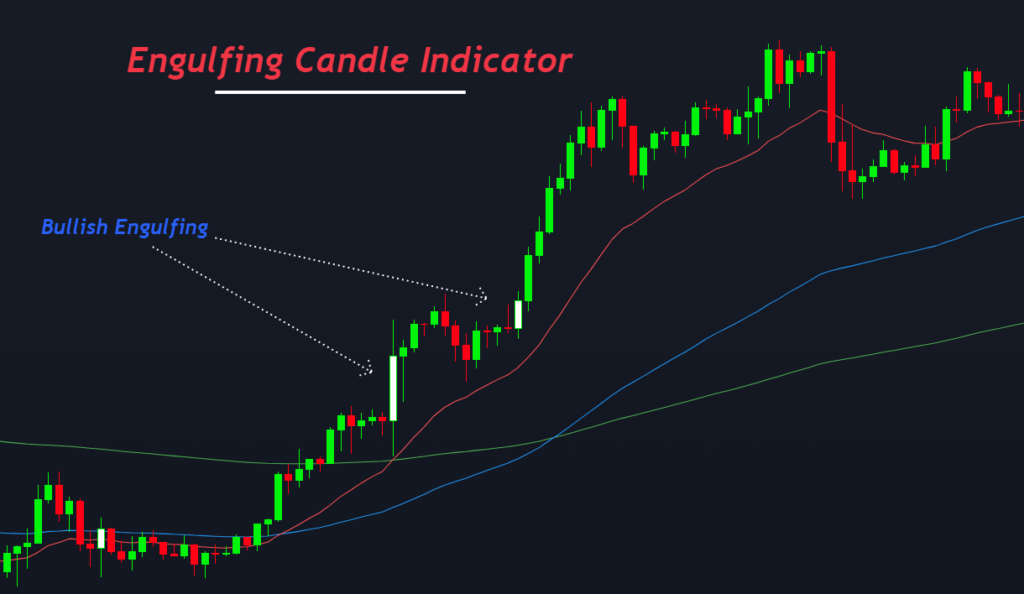
Bullish engulfing candlestick
Engulfing candlestick pattern consists of two opposite color candles. The most recent candlestick fully engulfs the body, and the high and low of the previous candlestick is bullish.
The previous candlestick has a red color, and the most recent candle has green color.
The body-to-wick ratio of both candlesticks should be greater than 60%. It means both candles should have a big body.
Bearish engulfing candlestick
In this pattern, the most recent candlestick fully engulfs the body, high and low of the previous candlestick. The most recent candlestick will have red color while the previous candlestick will have a green color.
The body-to-wick ratio of both candlesticks should be greater than 60%.
Tip: Some traders believe that if the recent candlestick engulfs the only body of the previous candle, then an engulfing pattern forms. While as a trader, I believe that the candlestick must also engulf the high and low of the previous candlestick.
Indicator working
When the conditions of engulfing candlestick meet, the indicator will highlight the pattern with white or black color. You can also change the color in the settings of the indicator.
Look at the image below for a better understanding.
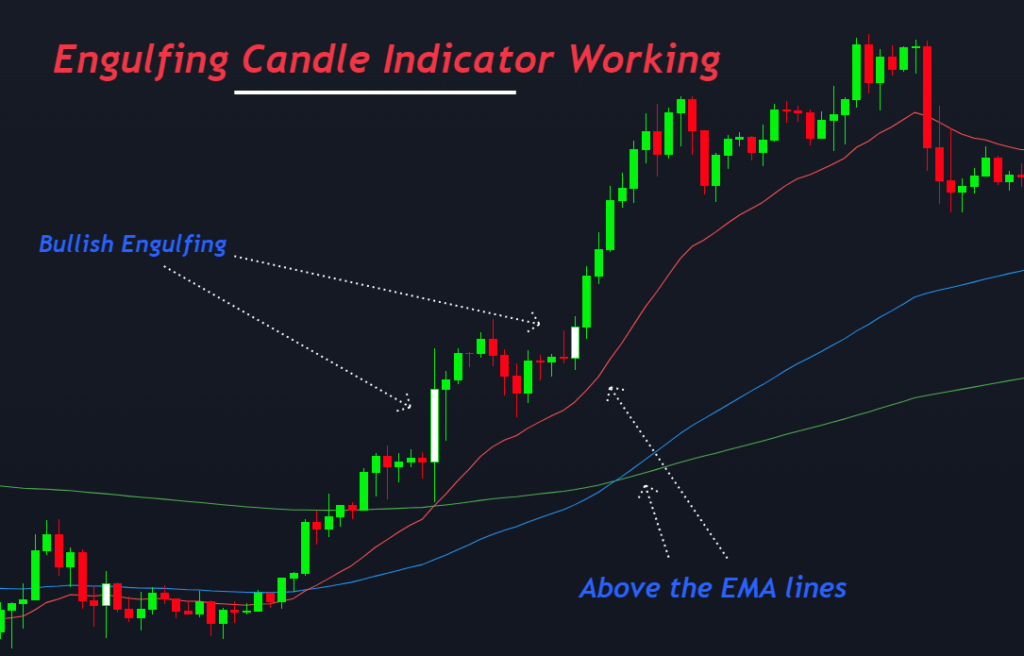
It will also draw three exponential moving average lines of 20, 75, and 200. It helps to filter the trend. You can also change these default settings according to your strategy.
How to trade with engulfing candle indicator?
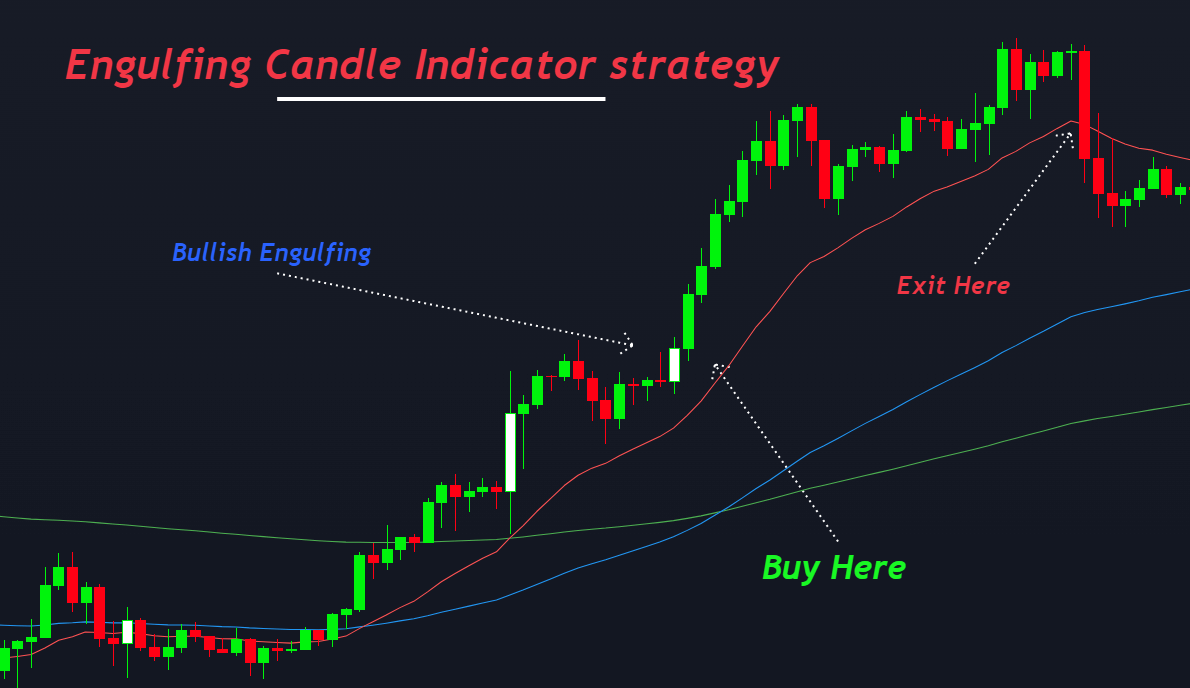
Here I will explain a simple strategy using this indicator. I recommend you make your trading strategy because unique strategies survive in forex trading.
I have used two confluences here:
- Engulfing candlestick pattern
- Three moving averages
According to strategy, open a buy trade when a bullish engulfing candlestick forms above the 20-period exponential moving average. All the moving averages should be below the price. It indicates a bullish price trend. So, by the confluence of moving average and candlestick pattern, a perfect buy setup formed like the image below.
All the exponential moving averages should be above the price to open sell order, and bearish engulfing candlestick should form below these moving averages.
Stoploss should be placed above the high/low of engulfing candlestick. Take profit level is dynamic. It would be best to hold the trade until the crossover of 20 periods moving average and price.

The Bottom line
Engulfing candlestick pattern is the base of technical analysis. This engulfing candle indicator has made it easy to identify the pattern without any screen time.
But I will advise you to manually check the trading setup instead of entirely relying on the indicator because every trade setup will not be winning. You should add other technical confluences to increase the winning probability of a trade setup.