
Definition
Exhaustion candlestick patterns are the trend reversal patterns that represent the maximum buying or selling activity resulting in trend reversal due to exhaustion.
For example, when buyers keep buying a currency, and most market participants are buyers, no sellers are left behind. It results in a bearish trend reversal. On the other hand, if most of the market participants are sellers and no buyers are left behind, then a bullish trend will form.
In this article, I will explain all four types of exhaustion candlestick patterns that will help you to determine the upcoming trend reversals in the market.
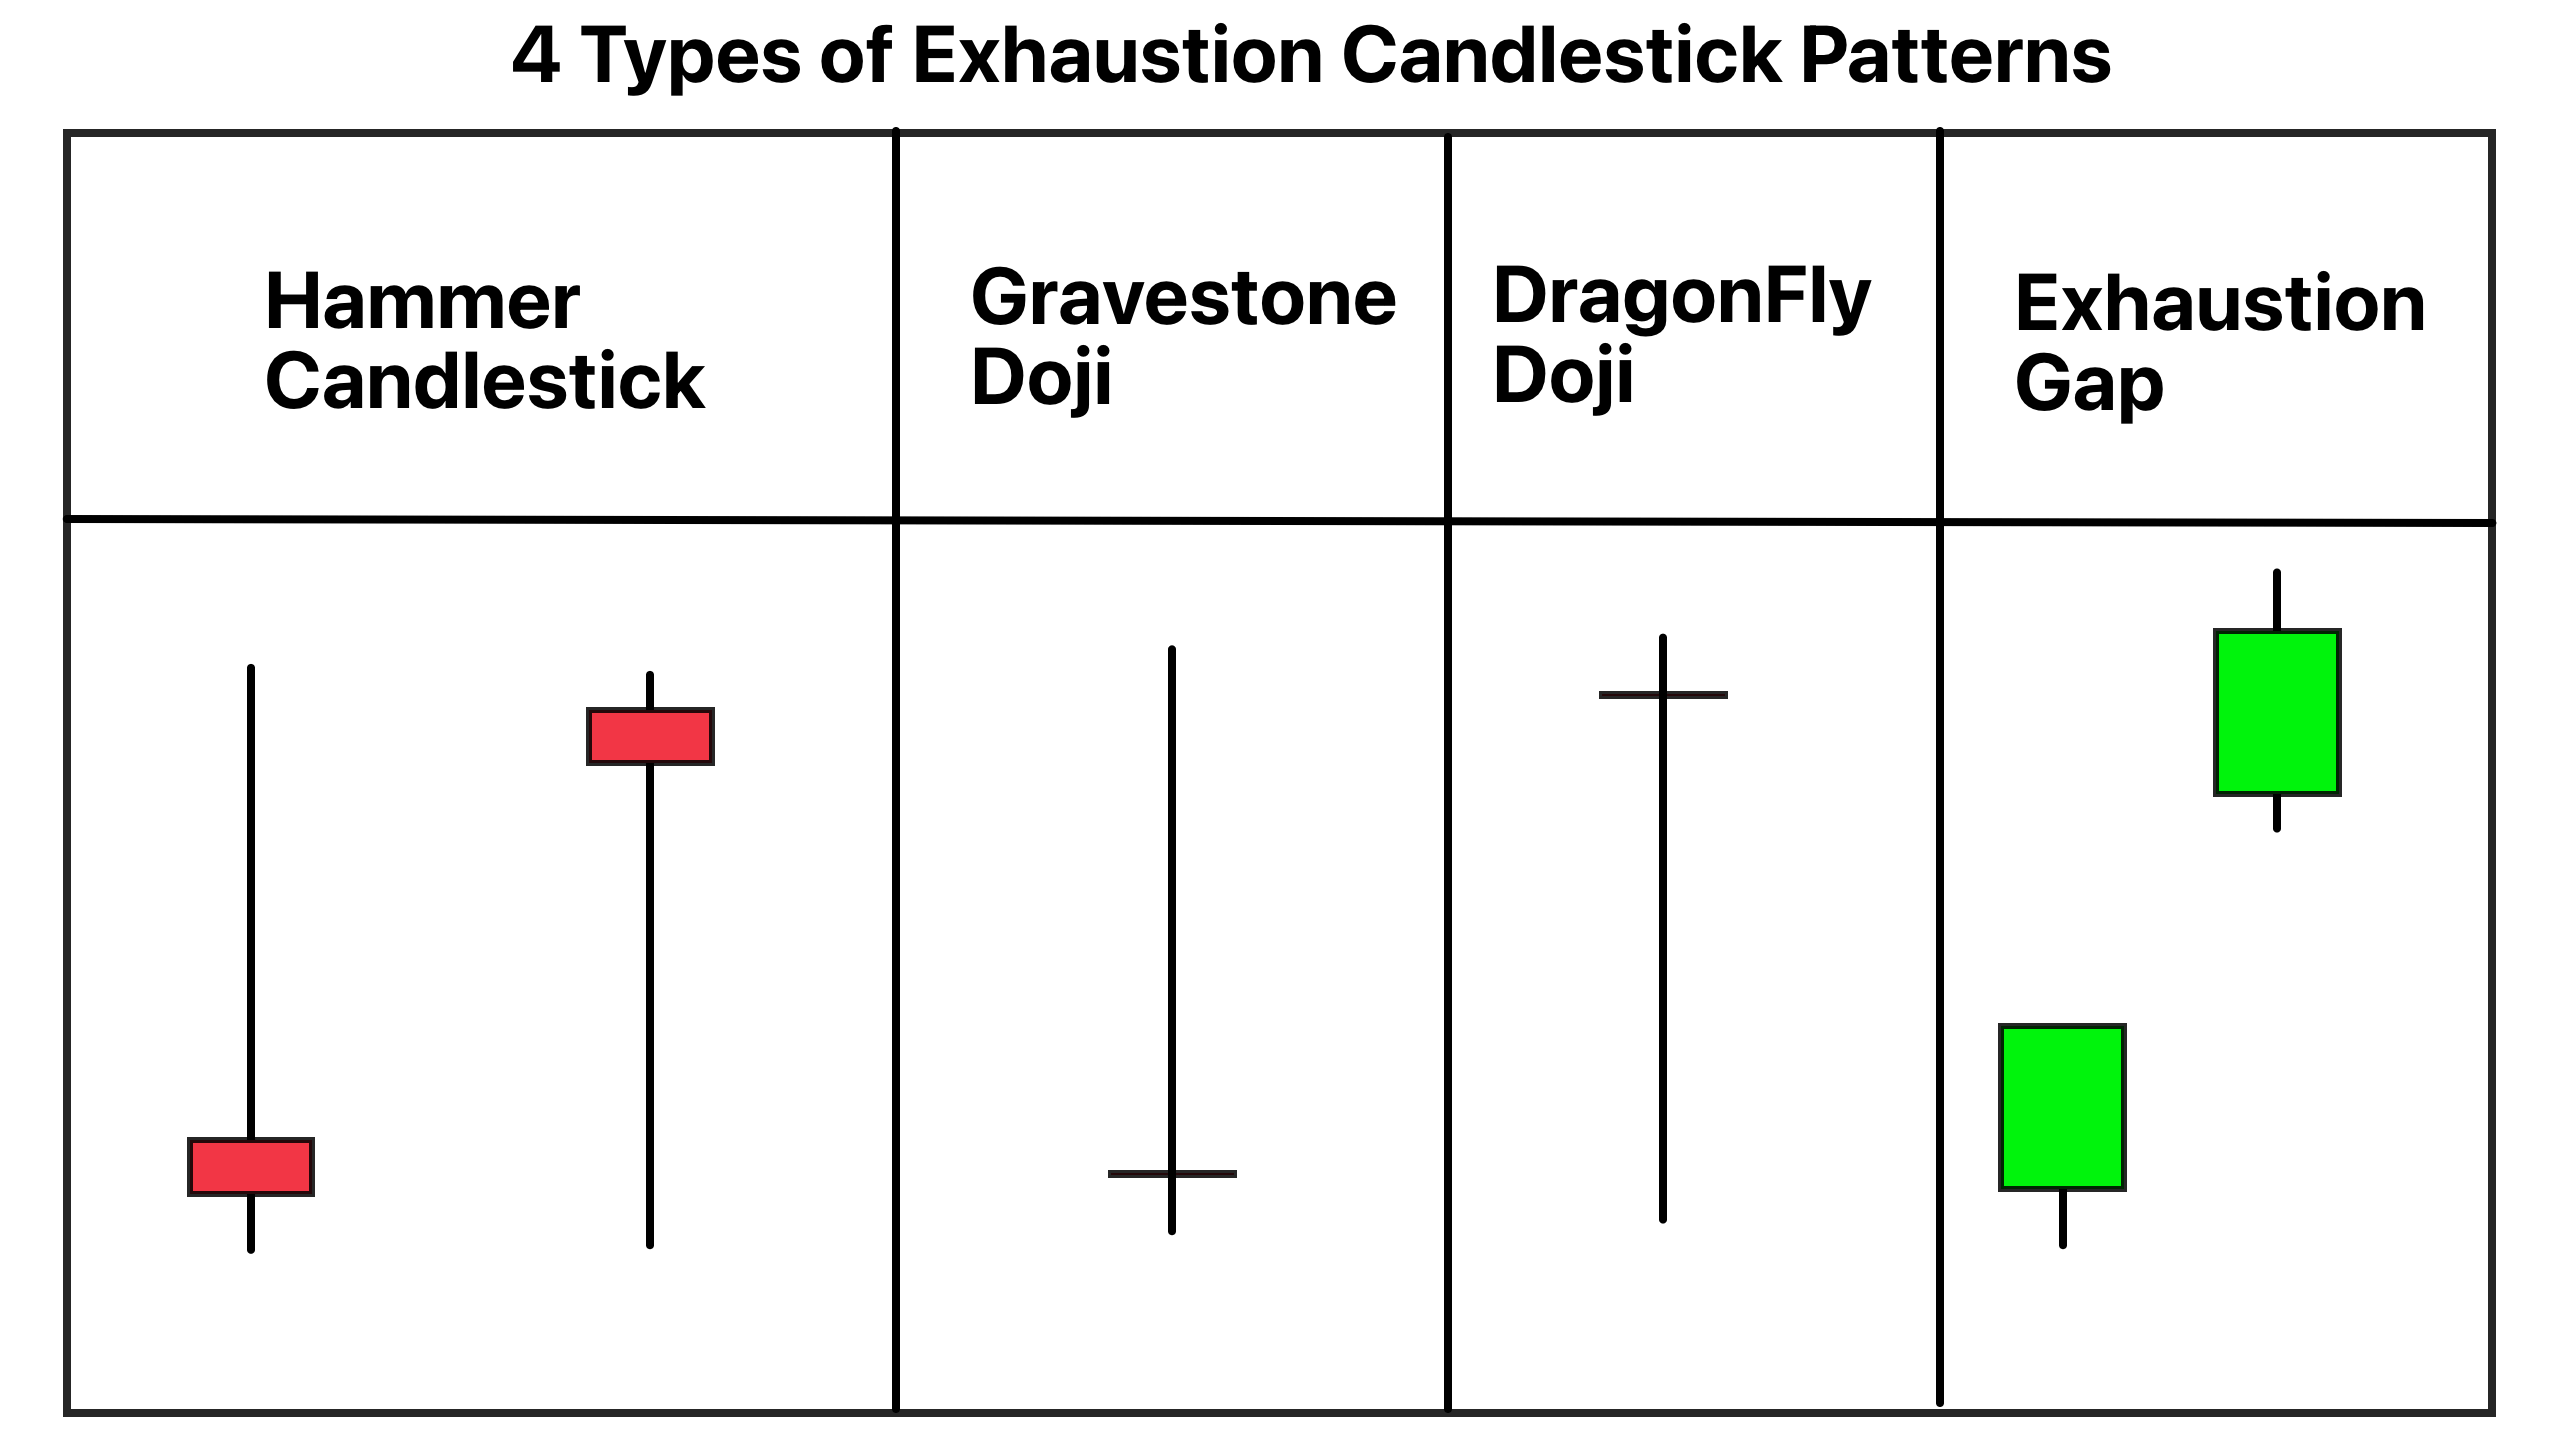
Types of exhaustion candlestick patterns
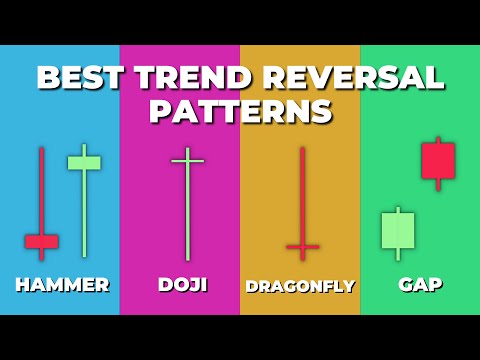
There are four types of exhaustion patterns in the technical analysis.
- Exhaustion gap
- Hammer candlestick pattern
- Dragonfly doji
- Gravestone doji
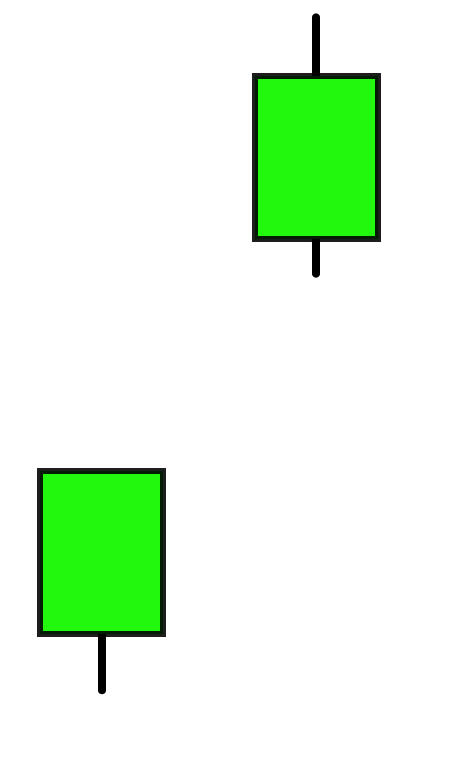
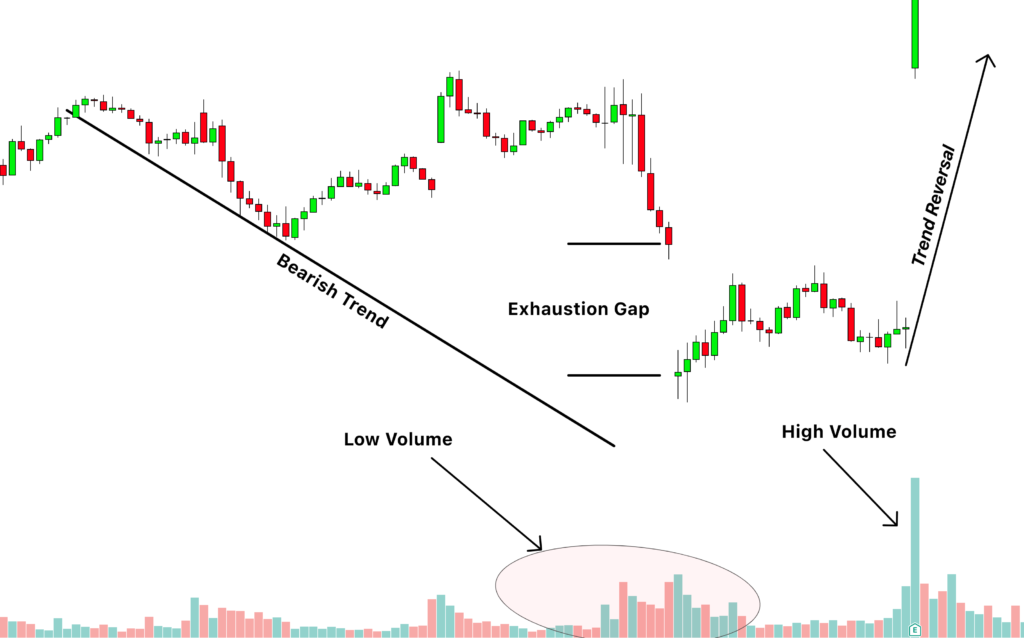
Exhaustion gap
The type of gap on the candlestick chart forms at the end of a trend. The exhaustion gap is simply the last and final try of buyers or sellers to continue the previous trend. The first condition of this pattern is the trend. If there’s no trend in the market, then the exhaustion gap will not form.
To trade the exhaustion gap, we will add the confluence of volume. I will explain the trading strategy at the end of this article.
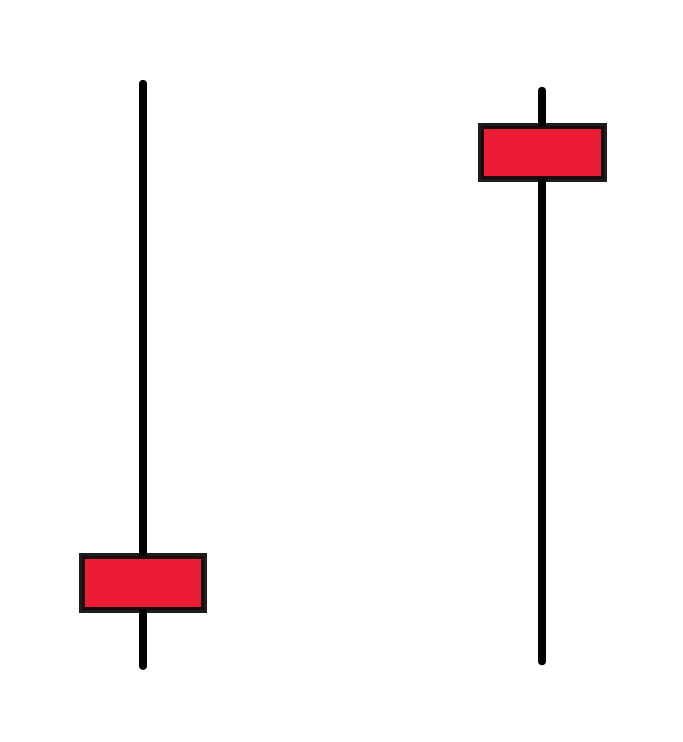
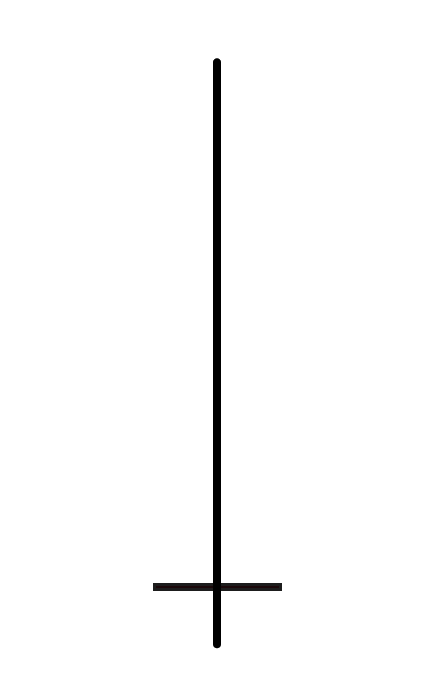
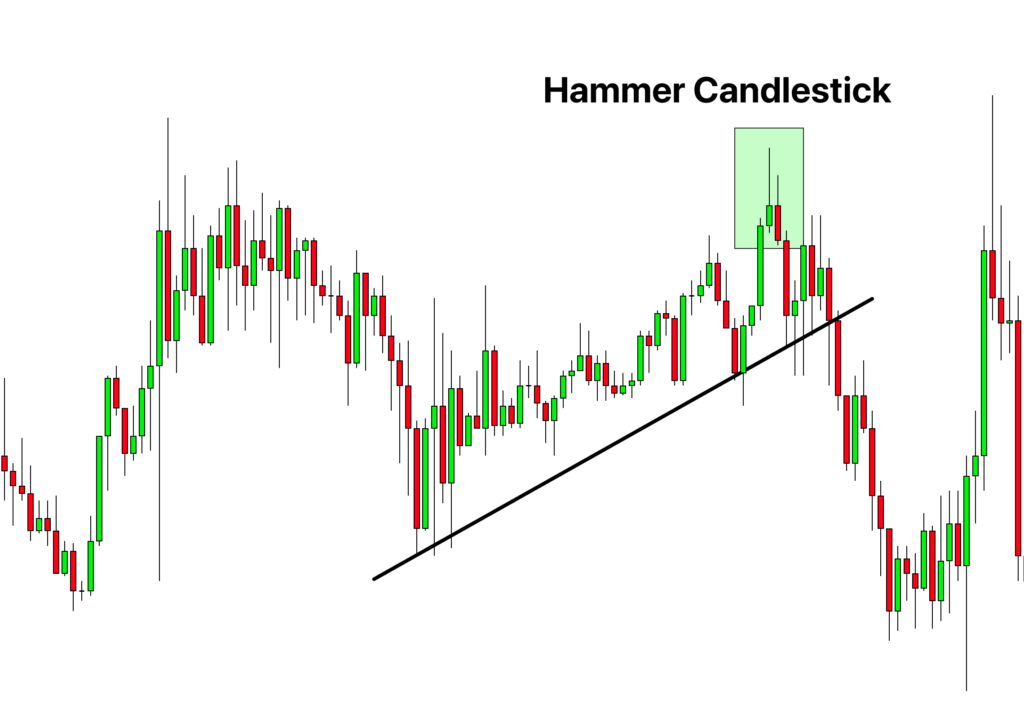
Hammer candlestick pattern
The hammer candlestick is also an exhaustion candlestick that forms at the peak of the trend. It consists of a long tail with a small body. When the hammer candlestick forms at the end of a bullish trend, then a bearish trend reversal occurs, while when the hammer candlestick forms at the end of a bearish trend, then a bullish trend reversal occurs.
The long tail of the hammer candlestick shows the exhaustion of buyers/sellers in the market.
In a bullish trend reversal, the tail of the wick of the hammer candlestick will form on the lower side, while it will form on the upper side in case of a bearish trend reversal.
Dragonfly doji
Dragonfly doji is also an exhaustion candlestick pattern, similar to the bullish hammer candlestick. However, it does not have the body because it has the same opening and closing price with a long tail on the lower side. Which makes the dragonfly doji a bullish trend reversal candlestick pattern.
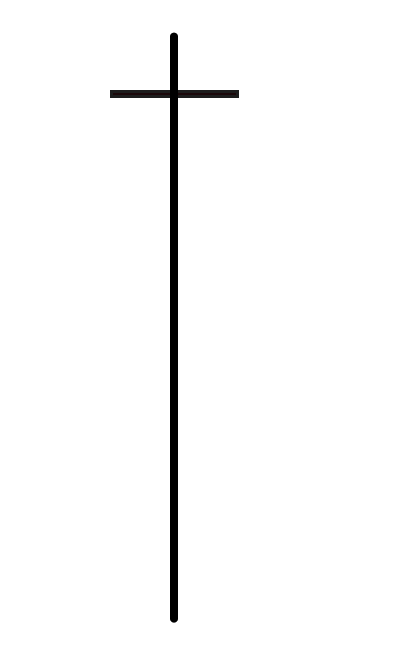
Gravestone doji
It also acts as an exhaustion candlestick pattern with the same opening and closing price and a long upper tail. It forms at the end of the bullish trend and is a bearish trend reversal candlestick pattern.
The psychology behind the exhaustion candlestick patterns
The exhaustion candlesticks show the upcoming trend reversal in the market. The structure of each exhaustion candlestick shows that market participants are exhausted from buying or selling a currency/stock or exhausted due to maintaining the previous bullish or bearish trend.
Now market makers will be unable to continue the previous trend, and they will push the market with a last try, and this last try of market makers appears in the form of exhaustion patterns on the candlestick chart.
This is the main reason for forming these candlestick patterns, and then a trend reversal occurs.
The Gap in the market forms only when many market orders are placed instantly. And also, a long tail or large wick forms when many orders are placed in the market. So these indications represent the exhaustion or last try of the market to maintain the previous trend.
There are ups and downs in the market. No market can remain bullish or bearish forever. It happens in the form of a repetitive cycle.
So by using these strategies, we can determine the upcoming trend reversal and make a profit from the market.
How to trade the exhaustion patterns?
There are many ways to trade these exhaustion patterns with other technical tools like support resistance, supply-demand, and order block zones. However, we will trade the exhaustion gap pattern with the volume and the candlestick patterns with the supply-demand or support resistance zones.
Exhaustion gap trading strategy
Exhaustion gap pattern forms at the end of the trend. However, it’s not confirmed that trend will change. That’s why I will add a confluence of volume. You can also use the divergence indicator with this.
Open a buy trade when the exhaustion gap forms at the end of the bearish trend and volume remain low during the gap. Because the volume should be higher during the gap formation, but the low volume shows divergence. That’s why you should open a buy order during these conditions.
Open a sell trade when the exhaustion gap forms at the end of a bullish trend and low-volume activity.
Exhaustion candlestick patterns trading strategy
In this trading strategy. We will add the confluence of supply and demand zones with the exhaustion candlestick patterns like a hammer, gravestone doji, and dragonfly doji.
Open a buy trade when the gravestone doji or bearish hammer candlestick patterns form at the supply zone. Then place a stop loss above the high of the tail or zone.
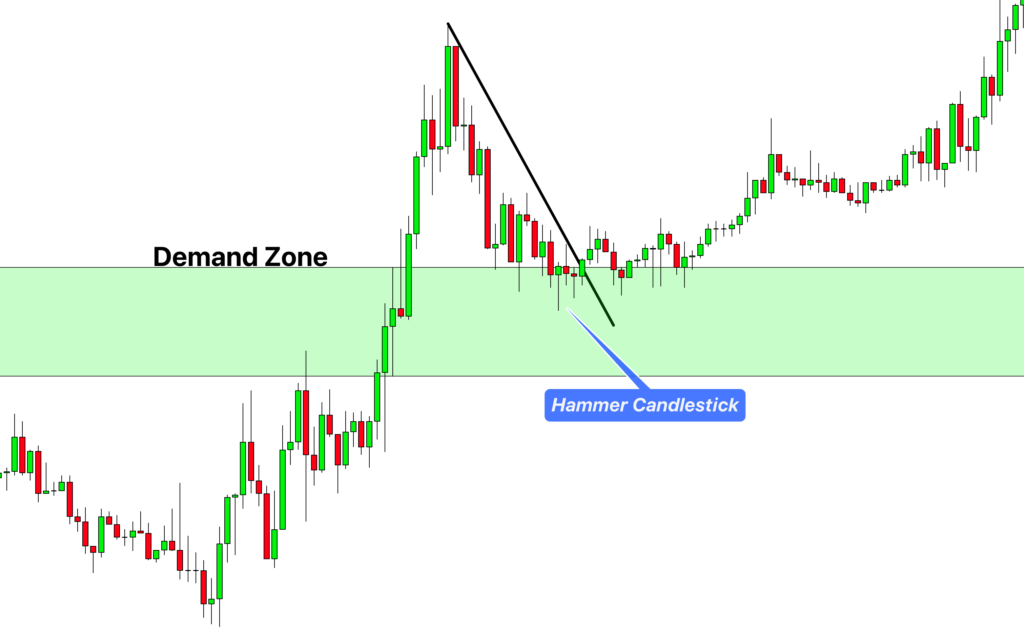
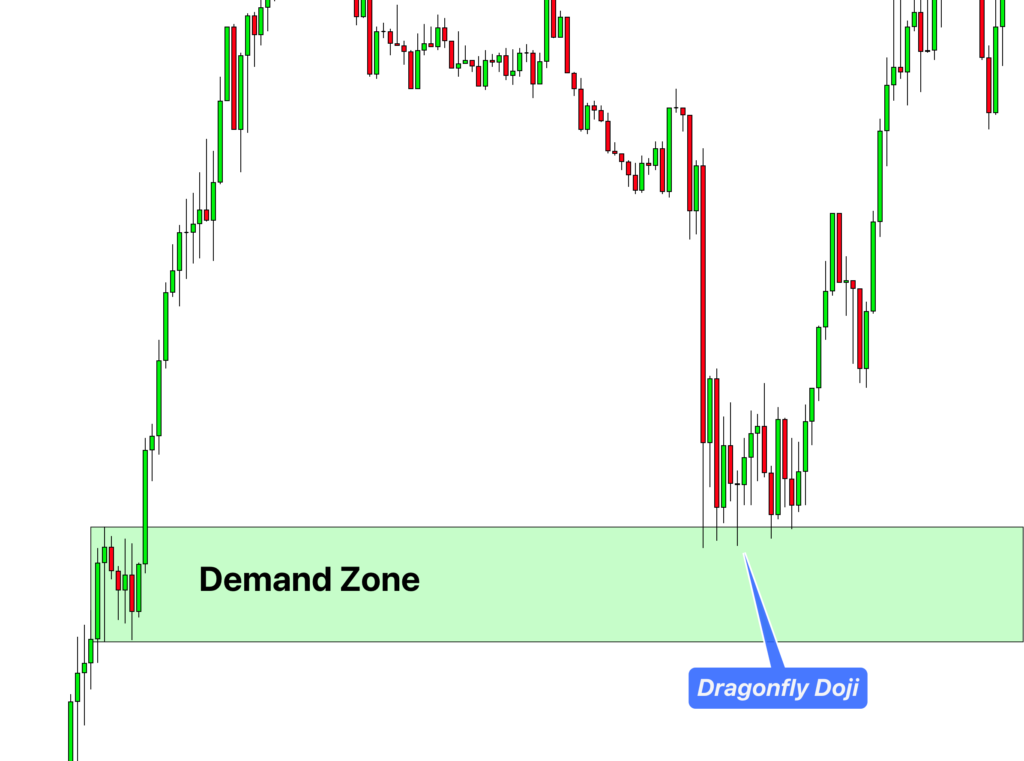
Open a sell trade when the dragonfly doji or bullish hammer candlestick pattern forms at the demand zone. Then place a stop loss below the low of the tail or the zone.
The bottom line
If you are a trend reversal trader, I highly recommend learning and trading with exhaustion candlestick patterns. A trader should refrain from mixing things in learning many candlestick patterns when a few patterns can work well.
A trend reversal trader should learn the exhaustion patterns to get a high winning ratio in the trading strategy.
Comment below if you have any questions related to the above article.