
Definition
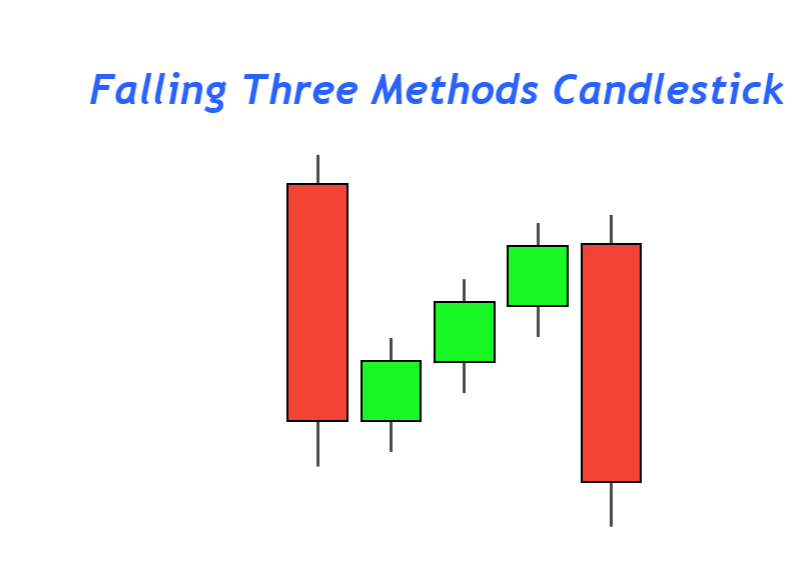
Falling three methods is a trend continuation bearish candlestick pattern that consists of five candlesticks. It represents that the previous bearish trend will continue, decreasing the price.
This pattern is formed by two big bearish candlesticks and three small bullish candlesticks between those big candlesticks. It is like a sandwich of two big and three small candlesticks. It is not a trend reversal candlestick pattern. Because of the nature of its structure, it only predicts the upcoming bearish trend.
How to identify falling three methods candlestick pattern?
Five candlesticks form in a specific sequence in the falling methods candlestick. Follow the following rules to identify a perfect candlestick pattern on the price chart.
- Rule 1: The first and last candlesticks must have a big bearish body with a 60% body to wick ratio because the big body represents the momentum of sellers.
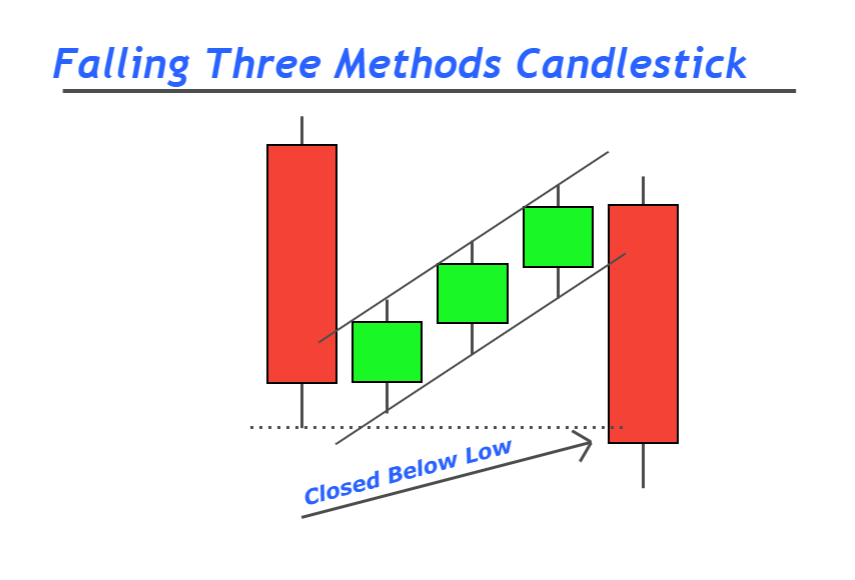
- Rule 2: Three small bullish candlesticks will form after the first bullish candlestick. These three candlesticks should make higher highs and higher lows. Remember that the fourth candlestick in this pattern must not close above the high of the first candlestick.
- Rule 3: The last bearish candlestick must close below the low of the first bearish candlestick.
These are three rules you should follow to identify a perfect candlestick pattern. There is a complete logic behind these rules. We apply rules to distinguish between false and real market patterns.
Falling three methods: Information Table
| Features | Explanation |
|---|---|
| Number of Candlesticks | 5 |
| Prediction | Bearish trend continuation |
| Prior Trend | Bearish trend |
| Counter Pattern | Rising three methods |
What does the falling three methods candle tell traders?
Falling three methods candlestick pattern indicates natural symmetry of price. You need to understand the basics of the price pattern to make good decisions while trading on a real account.
Let’s read the price pattern during this candlestick pattern formation.
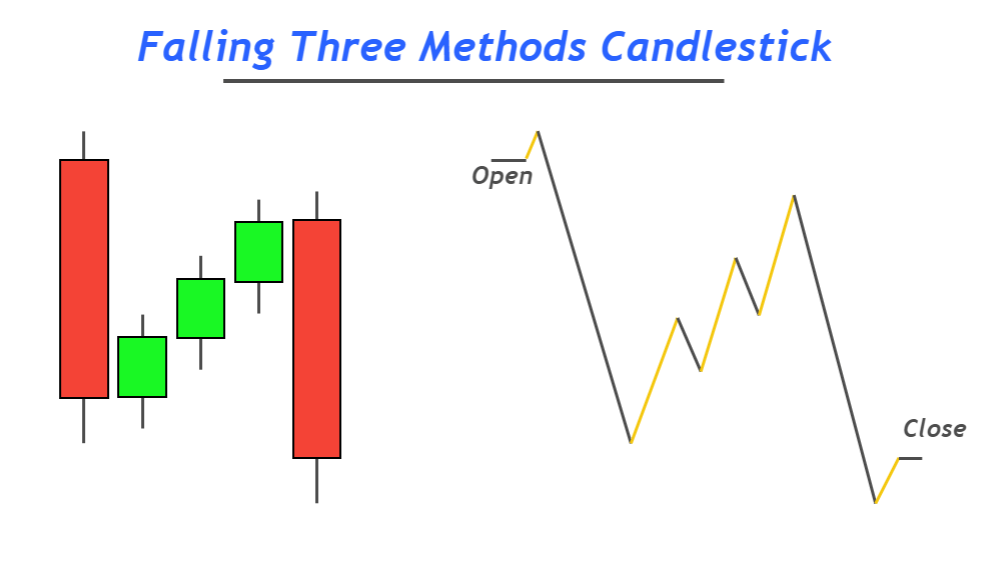
A big bearish candlestick on the price chart shows sellers’ momentum, which is greater than buyers. That’s why sellers are pushing the market in a bearish direction. It also represents the impulsive wave in the market.
After an impulsive wave, a retracement wave will form. The three small candlestick patterns show the minor retracement in the bullish direction in this candlestick pattern. After the retracement wave, an impulsive wave will start again.
The last bullish candlestick represents the bearish impulsive wave. It means the price will continue its bearish trend because minor retracements are bullish while big price waves are in the bearish direction.
Price shows the signs of buy or sell; you need to read the price on the chart.
Pro tip: Always read the price action on higher timeframes and trade on lower timeframes.

Find High Probability Trades with this ADVANCED Candlestick Patterns Course
The Ultimate Candlestick Patterns Course That Will Help You To Trade Better
How to trade falling three methods candlestick?
Before learning to trade this candlestick pattern, you should specify the best working condition by backtesting because it will help you refine good setups from the crowd.
Best working conditions
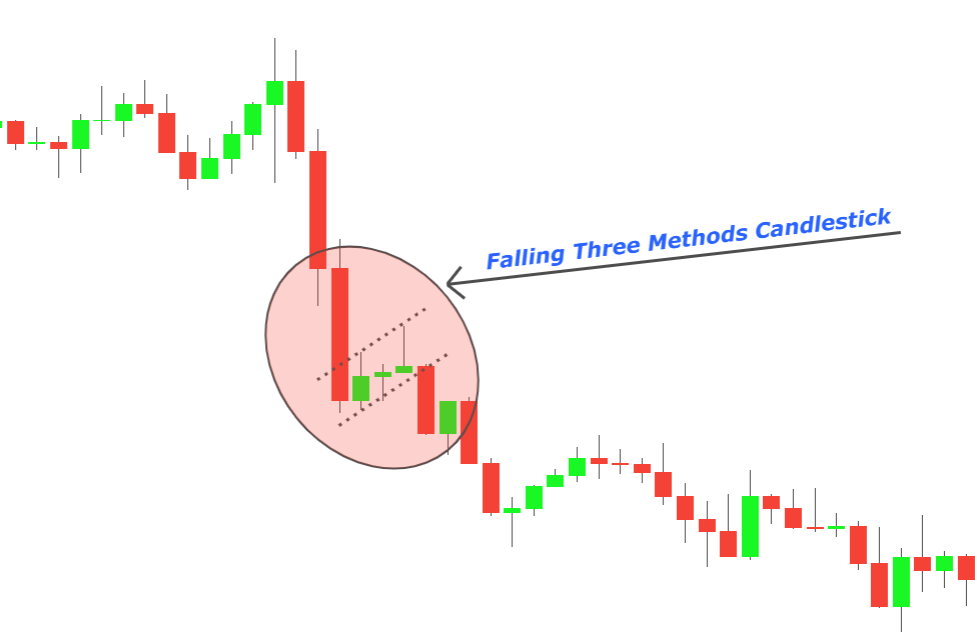
- Falling three methods will work during the bearish trend. It should form in the middle of the trend.
- Do not trade this trend continuation pattern at major reversal points like support or demand zone.
- Avoid trading this pattern during oversold conditions
Trading strategy for falling three methods candle
Place a sell order just after candlestick pattern formation and adjust stop loss above the high of the pattern. Fibonacci 1.618 and 2.618 levels of the total pattern will be the take profit levels.
The Fibonacci tool is used here because it is the best technical tool to identify strong levels for stop-loss and take-profit in trading.
Conclusion
Falling three method pattern forms on the chart rarely. But it can also be used to extend take profit levels. for example, a sell trade was opened, and now a falling three method pattern form. Then you can extend take profit levels by holding your trade because this candlestick pattern generated a bearish trend continuation signal.