
Definition
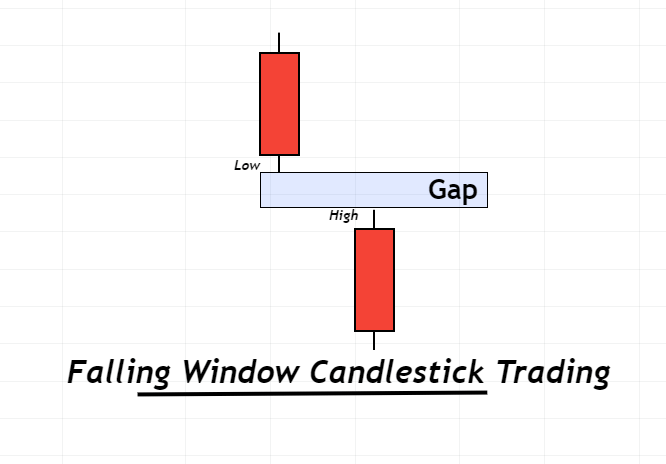
The falling window is a candlestick pattern that consists of two bearish candlesticks with a down gap between them. The down gap is a space between the high of the recent candlestick and the low of the previous candlestick. It occurs due to the high volume of selling orders in the market
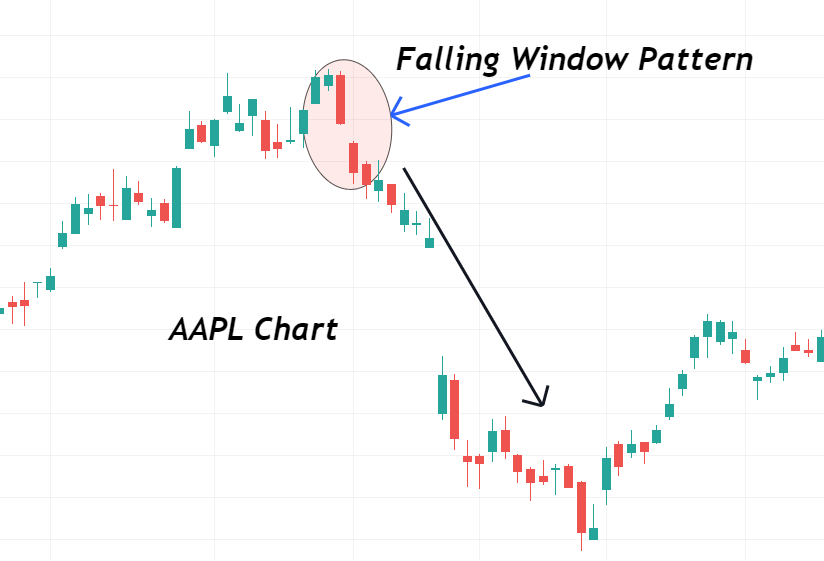
It is a Bearish trend continuation candlestick pattern that represents the strength of sellers in the market. The price of an asset/security will continue to move down when a falling window will form on the price chart.
How to identify a valid falling window pattern?
Follow the following procedure to find out a perfect falling window pattern on the price chart.
- Look for two bearish candlesticks and a gap between high of recently made bearish candlestick and low of previous bearish candlestick. Keep in mind that Gap should not be too much large.
- Bearish candlesticks should have big bodies because it is an indication of huge momentum of sellers.
- It should form during bearish price trend.
It is the best practice to trade the falling window pattern with a bearish price trend. Because it is a trend continuation pattern and it will work within trend only.
If the falling window pattern forms above the support zone then you should avoid trading it because the support zone will prevent trend continuation. On the other side, if this pattern forms after the support zone breakout then it is a good indication of bearish trend continuation.
Falling Window Pattern: Information Table
| Features | Explanation |
|---|---|
| Number of Candlesticks | 2 |
| Prediction | Bearish trend continuation |
| Prior Trend | Bearish trend |
| Counter Pattern | Rising window candlestick |
What does the falling window candlestick pattern tell traders?
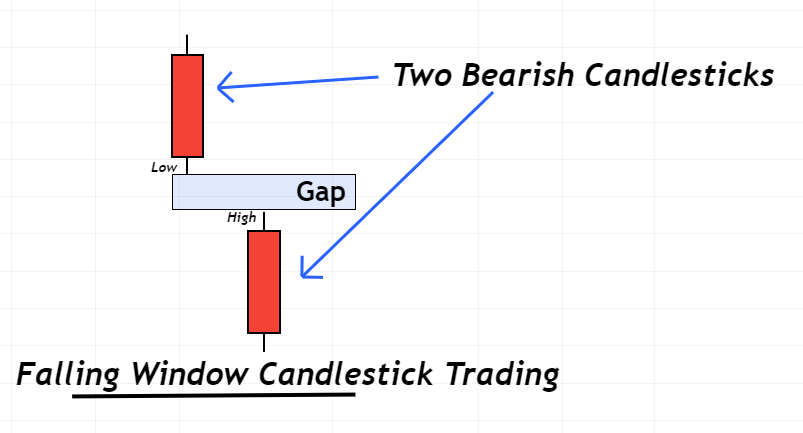
The falling window pattern is made up of two major parts and each part has a specific meaning.
- Two bearish candlesticks
- Down gap
By reading the price, you will be able to know the activity of professional traders behind the candlestick chart.
Bearish candlestick means that price of a day has closed below the opening price of the day. Straightforwardly, it represents that sellers were controlling the market and they bring the price down by overcoming the forces of buyers.
Pro tip: If you see a big bearish candlestick on the price chart then understand that market makers are pushing the market in a bearish direction.
A down gap on the price chart is formed when a large number of selling orders will be filled at once. This will cause a jump in the price movement and a gap will be created on the chart.
When Two bearish candlesticks and a down gap will represent that sellers are controlling the market, then you should understand that market will move downward due to the huge pressure of sellers in the market. Because three confluences combine to make a falling window candlestick pattern to forecast bearish trend continuation.

Find High Probability Trades with this ADVANCED Candlestick Patterns Course
The Ultimate Candlestick Patterns Course That Will Help You To Trade Better
How to trade falling window pattern?
The down gap in the falling window will also act as a resistance zone for the price. Because a large amount of selling orders at this zone will keep the price down until all the selling orders will not be filled.
After the falling window pattern, either price will continue to move downward or it will give a minor pullback towards the gap zone to fill some selling orders.
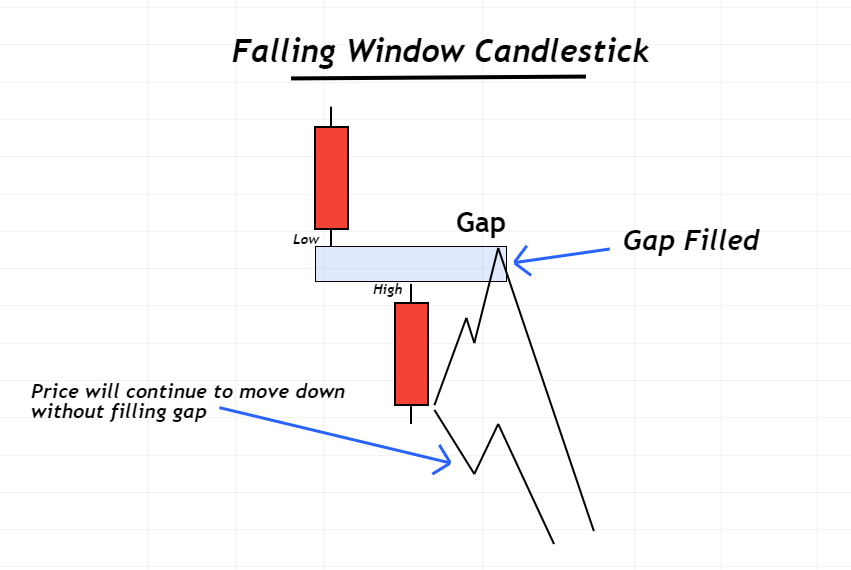
So there are two methods of trading falling window patterns. Either you can open sell orders just after this candlestick formation or you can wait until the price does not give a pullback towards the gap zone. Later will give a high-risk-reward trade setup.
Conclusion
Falling window candlestick is very helpful in forecasting the long-term analysis of stocks and indices. It will reveal to you information about bears in the market.
I highly recommend you to backtest this pattern at least 100 times to master it.