

In this article, we will learn about the use of Fibonacci not only for a retracement of price but also to get a target of price. The fibonacci tool can be used with supply and demand trading techniques to catch a pin point entry. Pin point entry in forex will increase risk-reward ratio due to a tight stoploss. For example, one trade with 1:5 risk-reward will increase your balance by up to 10%. ( 2% risk per trade ) three to five good trades are enough in a month. We will use a pinbar or engulfing candlestick pattern as a confirmation of the trade. Now let’s first discuss Fibonacci retracement and Fibonacci targets.
Fibonacci retracement:
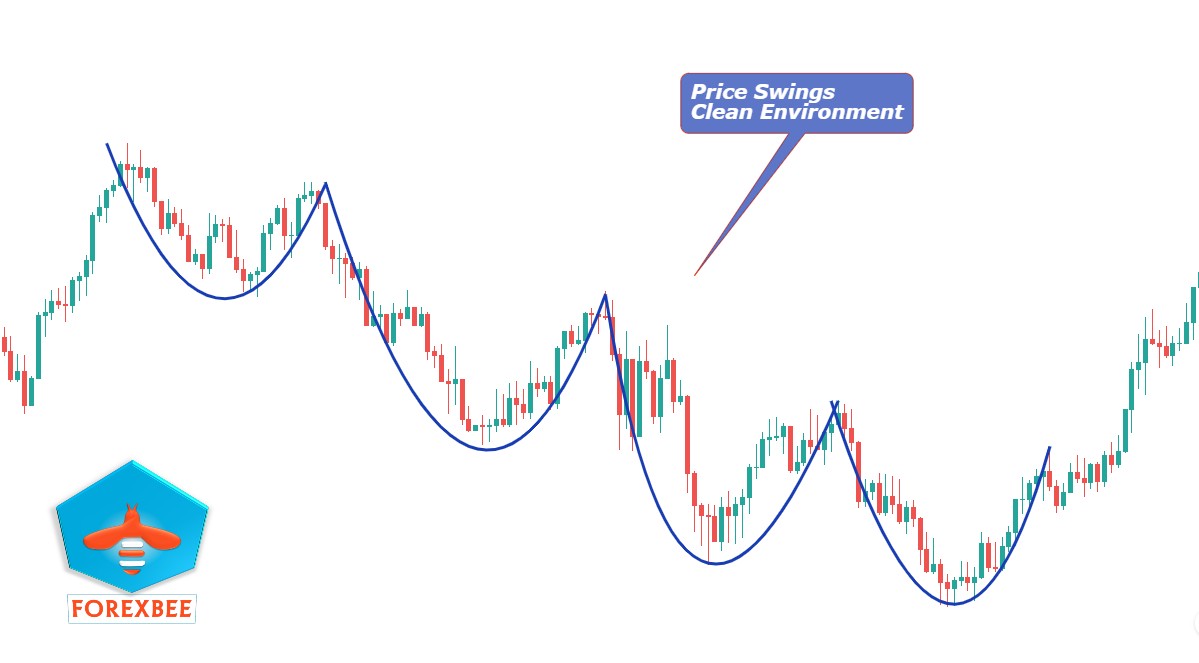
When you will look at the chart the most first thing you have to figure out swings in the price. either these swings are making higher highs or lower lows with a clean environment. or price is ranging horizontally to right. Avoid choppy market. When there is a trend in the price with a clean environment then it’s the right moment to get in and apply Fibonacci.
How to draw fibonacci retracement?
Pick a recently made swing by the price and mark the high and low points of the swing. Click on the Fibonacci tool in mt4 or tradingview and draw Fibonacci from low to the high of swing in case of a bullish trend.
In case of a bearish trend, draw Fibonacci from high to low of the swing. The Fibonacci levels in which we are interested are 50, 61.8 and 78.6. Remove the rest of the levels from the Fibonacci tool in the setting. Then we will wait for the price to retrace to these levels and a pin bar or engulfing candle at these levels will give us a confirmation for buy or sell trade. But as you are reading this article on forexbee then supply and demand must be there. We will also add supply and demand confirmation with Fibonacci.
Most retail traders will say that Fibonacci will not work. But as we will look for a fresh demand or fresh supply at the Fibonacci levels with a candlestick confirmation then this will become a high probability setup.
For example, the price is retracing Upward and there is a Supply zone at 61.8 fibo level. but if the price breaks the Supply zone then we will not enter that trade because if the price is consumed in a supply zone then it has a probability it will go up to the next supply zone. So Supply zone will help us here to avoid the false move.
How to draw Fibonacci targets ( Fibonacci extensions )?
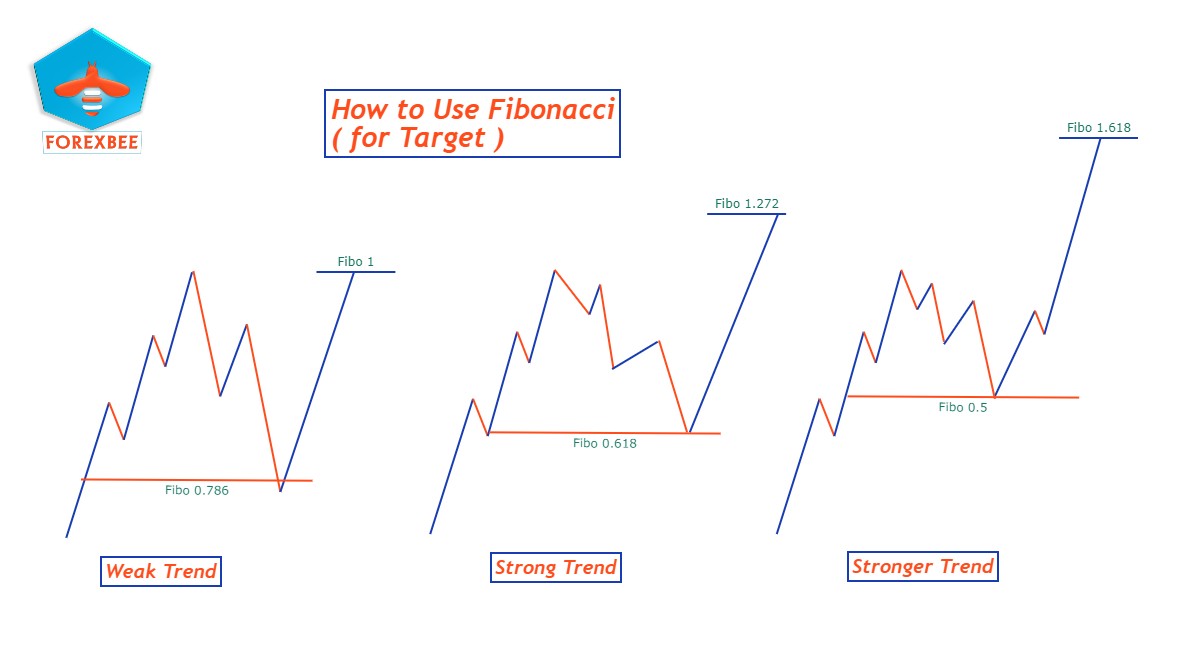
I will not go into detail about this topic. I will remain straightforward. In the previous topic, I have told you about Fibonacci retracement. After Trade entry from retracement, our focus is always on the target. Most retail traders will close a trade early and some of them will hold too much. But I will give you a simple strategy to use Fibonacci targets to get maximum profit from trade with fixed rules and without any psychological issues. Let’s see in the image below.
- If the price retraces to 78.6 Fibonacci level then our target will be at the origin of retracement. Retracement to 78.6 level indicates a weak trend.
- If the price retraces to 61.8 Fibonacci level then our target will be at 1.272 Fibonacci extension level. We will draw Fibonacci on retracement and then we will get the fibonacci extension level. Retracement to 61.8 level indicates a strong trend.
- If the price retraces to 50 Fibonacci level then our target will be at 1.618 fibonacci extension level. Retracement to 50 Fibonacci levels indicates a stronger trend.
How to use Fibonacci with supply and demand?
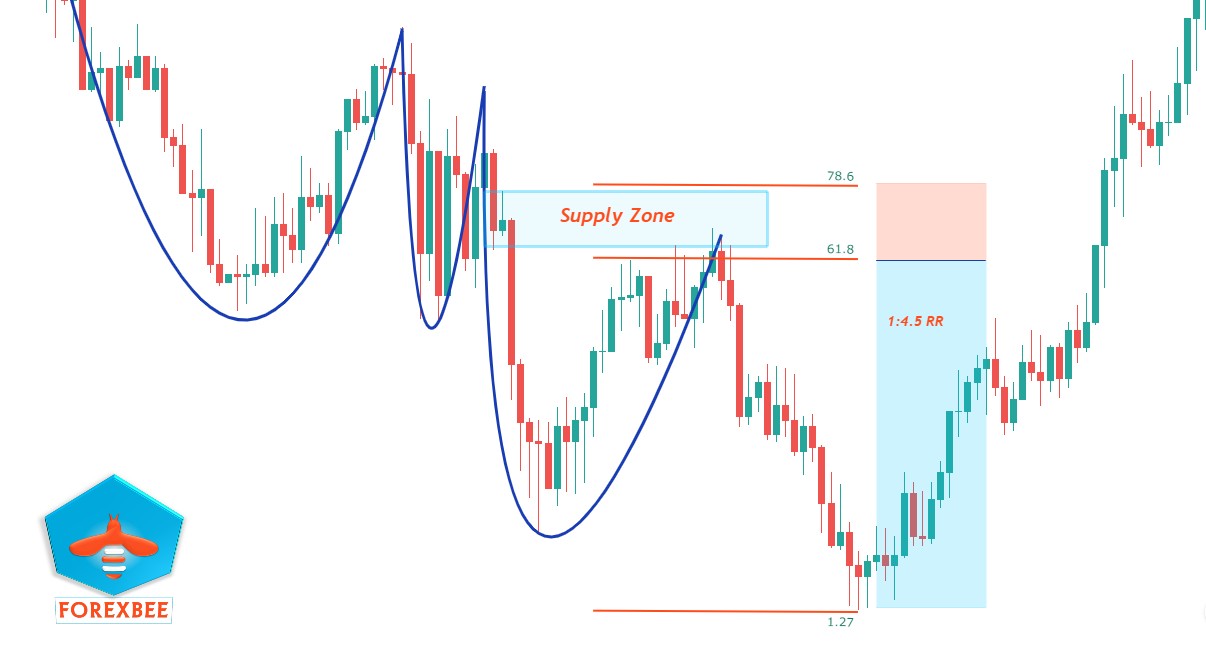
The usage of Fibonacci with supply and demand is our main point of the article. I will explain with an example. See the chart below. There are swings in price with a clean environment. I have drawn a supply zone there. If you don’t know about supply and demand then click here to learn SnD in detail. The supply zone is at 62.8 fib level. Price retraced to 61.8 fibonacci level. Just touched supply zone and then in profit. At the supply zone or Fibonacci level, we will look for a pinbar or engulfing candle on any lower timeframe.
For example, if you are trading m15 timeframe then you have to look at m5 m3 even at m1 for pin bar or engulfing candle. This will be our confirmation for entry in trade and stop loss will be always above 78 fibo level. If the supply zone is at 78 fibo levels then stop loss will be above the supply zone.
As the price retraces to 61.8 Fibo level so our target will be at 1.272 Fibonacci extension level. See in the image below target hit. We gained maximum profit without any psychological issue.
Behaviour and discipline are most important in trading forex. Be patient and pick only four to five trades in a month and you will be profitable at the end of the month. Education of such type about forex technical analysis will be shared only on forexbee. No other website will share education like this about forex except forexbee. If you are looking to master Price Action in forex then no doubt you are in right place.
Fall in Love With The Process And The Results Will Come.
I hope you will like this Article. For any Questions Comment below, also share by below links. Use Tradingview for technical analysis instead of mt4. Join Telegram to get trade ideas free.
Thanks
Note: All the viewpoints here are according to the rules of technical analysis. we are not responsible for any type of loss in forex trading.