
FVG in trading means the fair value gap, which refers to the difference between the current value of an asset or currency and its fair value due to inefficiency or imbalance in the market.
Fair value gap is the most important term in price action trading that a trader should understand. There are many uses and benefits of fair value gaps in trading. It can also be used as a target or trade entry level.
I will explain the fair value gap in detail with a trading strategy in this article, so read the complete article.
How to identify the fair value gap?
There are two ways to identify the fair value gap in trading the financial market.
The first is by fundamental analysis, such as market inefficiencies, information asymmetry, or irrational behavior by market participants.
The second method is to determine the FVG by technical analysis, such as analyzing the candlesticks to determine the imbalance.
I will explain the second method as we focus only on price action and technical analysis.
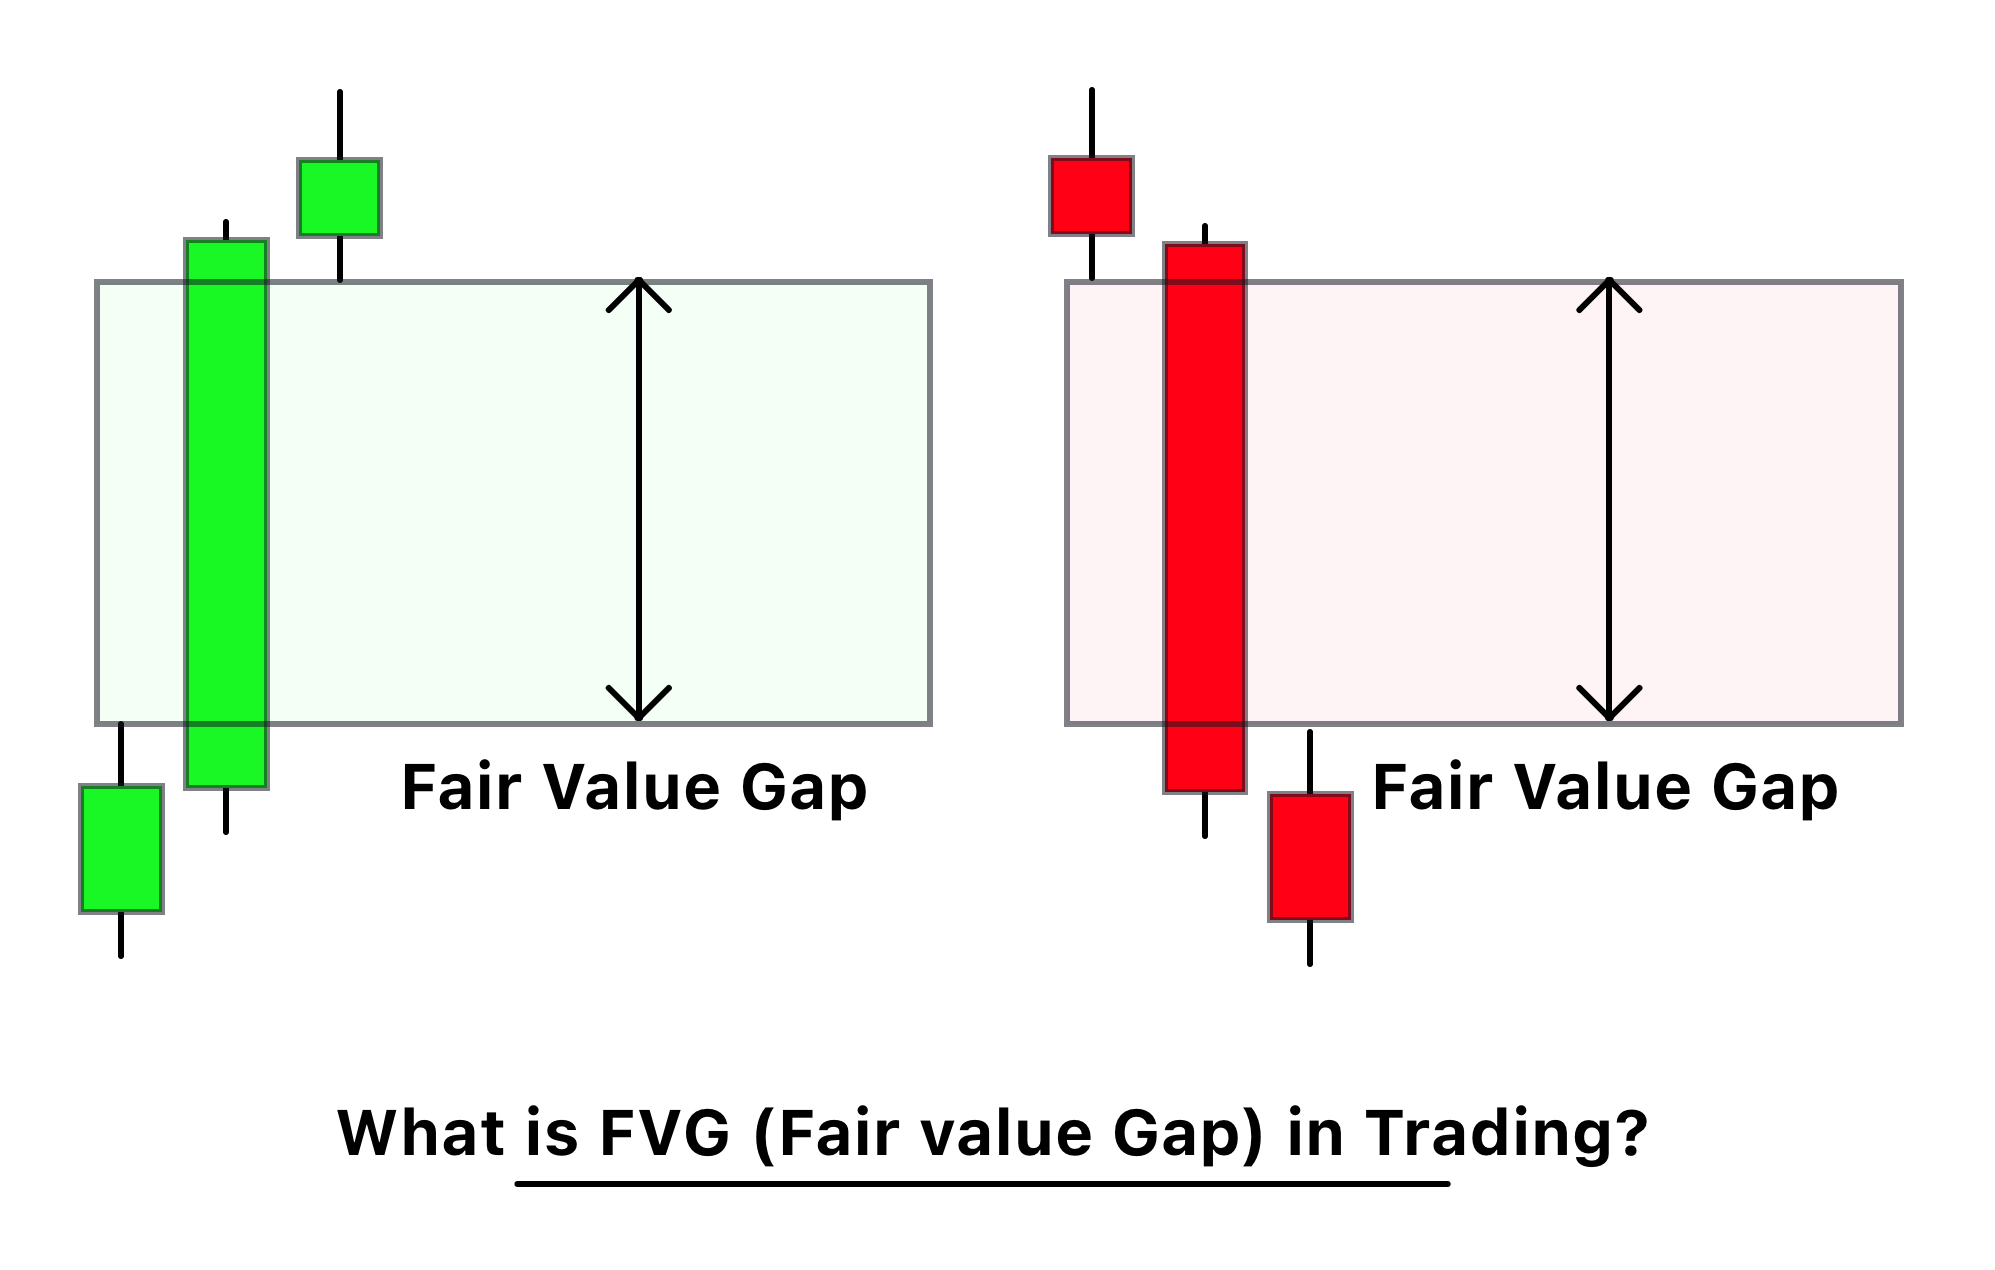
To determine the FVG in technical analysis, follow the following criteria:
- Find a huge-size candlestick with a 70% body-to-wick ratio. You should compare the candlestick size with the last 20 to 40 candlesticks.
- Now analyze the neighboring candlesticks. Both neighboring candlesticks should not overlap the big candlestick. A minor overlap can happen on the upper and lower side of the big candlestick.
- The price area between the previous candlestick’s low and the next candlestick’s high will act as the fair value gap or FVG.
Types of fair value gaps
Based on fair value difference, the FVG is categorized into two types
- Undervalued FVG
- Overrated FVG
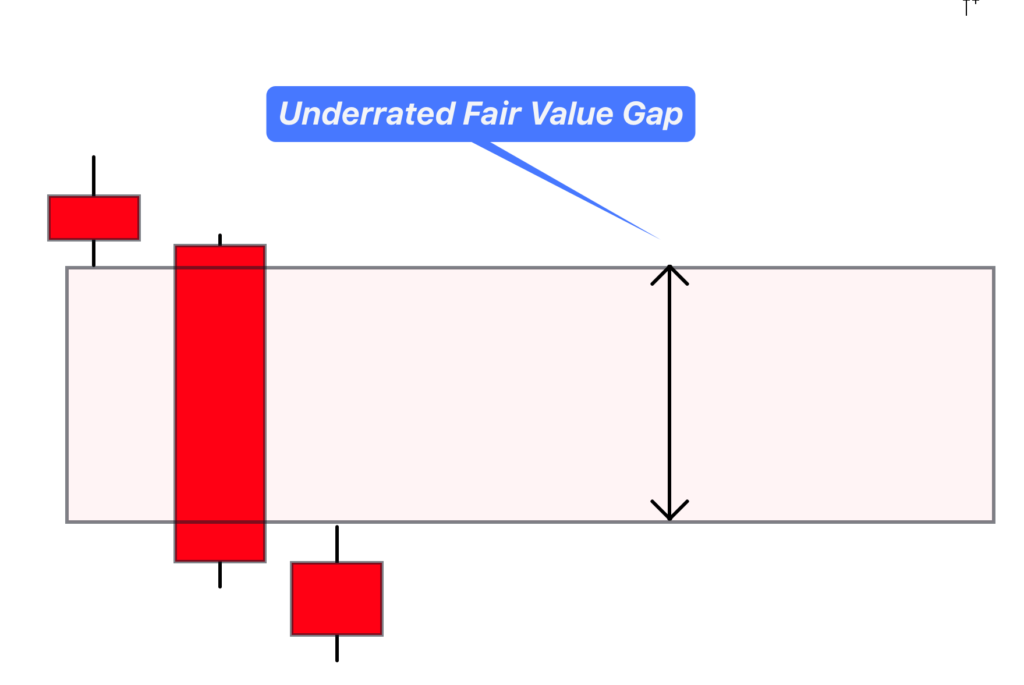
Undervalue FVG: it means that the price of a currency or financial asset is lower than its fair value. In this case, a price will increase in the future to balance this inefficiency. In technical analysis, a big bearish candlestick will show the FVG.
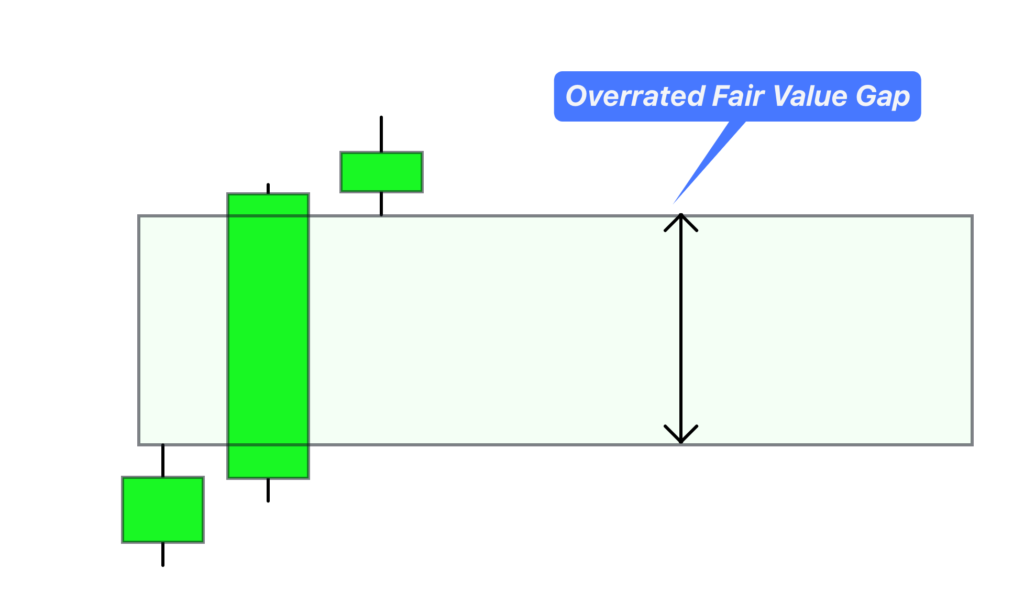
Overrated FVG: it means that the price of a currency or financial asset is higher than its fair value. In this case, the price will decrease to balance the inefficiency. In technical analysis, a big bullish candlestick will show the FVG.
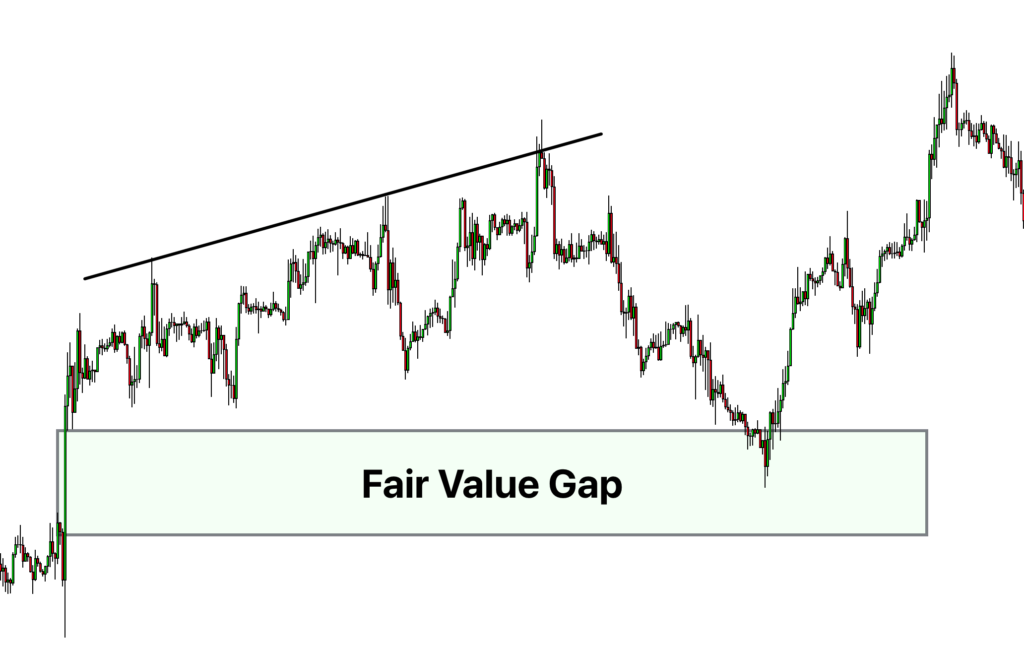
How to draw the fair value gap zone on a candlestick chart?
To draw the FVG gap on the candlestick chart, we will use neighboring candlesticks’ high and low prices.
- In the undervalued FVG, draw a rectangle using the previous candlestick’s low and the next candlestick’s high. Then extend the rectangle to the right until the price fills that zone.
- For overrated FVG, draw a rectangle using the previous candlestick’s high and the next candlestick’s low. Then extend it to the right until the price fills that zone.
Click Here Get Access to Fair Value Gap Indicator
What does the fair value gap tell traders?
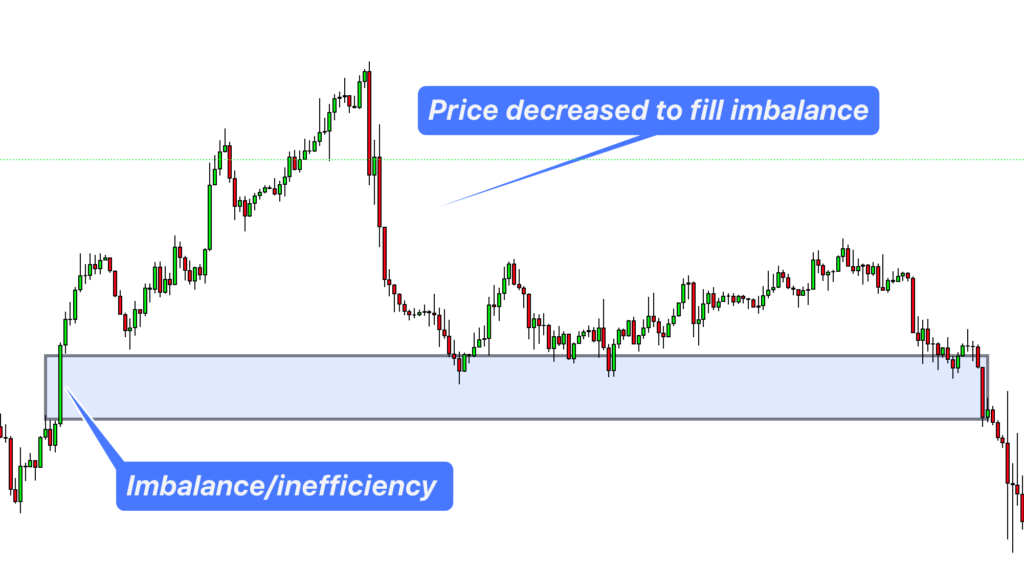
The fair value gap acts as a magnet for the price. Because it is a rule of nature that everything wants to come to rest or be balanced. In the same way, the price also wants to remain in balance. So, when an imbalance is created, the price tries to balance it.
In technical analysis, the price will balance the FVG gap zone. It will remain imbalanced if the price does not overlap the FVG zone.
The trading market is purely natural and works on the laws of nature. In technical analysis, we use those laws of balance and imbalance to forecast the trading market.
In short, the FVG tells traders the possible future direction of price.
For example, if there is an undervalued FVG, we can say that price will increase to fill that FVG zone.
How to trade the fair value gap?
There are two ways to trade the fair value gap. One is by adding the confluence of other technical tools with the FVG, while the other uses the price bounce from the FVG zone.
I will explain both methods. However, I suggest the first method that contains the confluence of other technical tools because it is a high-probability method.
Method 1
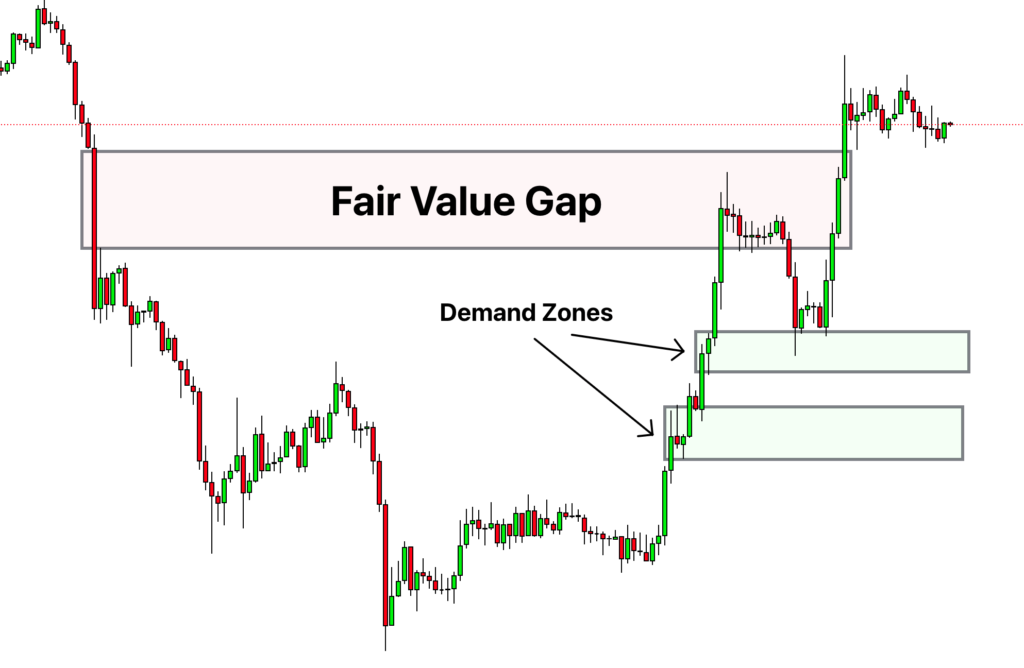
I will use this method’s supply and demand zones with the fair value gap. You can also use the order block zones instead of supply and demand. It depends on your strategy.
Here we will combine the undervalued FVG with the demand zone while the overrated FVG with the supply zone.
Buy signal
- Find an undervalued fair value gap on the candlestick chart that is unfilled. Then draw a rectangle on the chart to highlight it.
- Look for the demand zone on the chart. When a demand zone forms, buy from the demand zone with a stop-loss level below the zone.
- Close the trade once the price fills the FVG. Here FVG zone will act as take profit level.
Because the price must fill the imbalance zone, we know the future price direction. That’s why we used the demand zone to confirm the direction and also managed the risk with tight stop loss and high-risk reward ratio.
Sell signal
- Find an overrated fair value gap zone on the candlestick chart.
- Then look for a strong supply zone and sell from the supply zone keeping stop-loss above the zone.
- Close the trade once the price balances the inefficiency or fair value gap.
Method 2
Most of the time, the price bounces from the FVG zone. For example, if the price is in a bullish trend and there is an overrated fair value gap. Then the price will retrace to the FVG zone, and after filling this gap, the price will bounce and will continue the bullish trend.
This method makes it hard to get exact entry and stop-loss prices. You should always add other technical tools, such as candlestick patterns. For example, when the price fills the zone, look for a bullish candlestick pattern and open a buy trade with a stop loss below the low of the candlestick pattern.
It would be best if you traded toward the trend in this method to get a higher winning ratio. For example, look for overrated FVG zones if the trend is bullish. While if the trend is bearish, then find the underrated FVG zones.
Conclusion
Believe me that the fair value gap is the advanced price action concept, and most technical analysis traders don’t know about this concept. it also works most of the time and can help get a high winning ratio with a high-risk-reward ratio.
I use the fair value gap and supply and demand in trading. Because these are the most advanced concept of technical analysis. I highly recommend learning the fair value gap to master the technical analysis.
I have been loosing for a long time and I believe FVG will help me to recover as I this is the advanced method
Thanx
You switched the drawings for the undervalued and overrrated FVG
Thank you
Just be aware that supply and demand zones dont work anymore, backtest it and see, institutional money will generally break through S&D zones to take out stops to fill their orders. Use FVG and watch the big money turn the tide, thats when you jump in.
I want to say thank you guys for the hard work making a lot of sense and more knowledge about the whole system and FVG and supply and demand and order block, they all works just like the way big banks Institutions uses In the financial market. I’ve learned a lot and put a lot of efforts to learn on my own with this training material and it makes a lot of sense to me because it help to make strong trading decision In this business. I really love learning to become a better trader.
thank you guys again