
Gann Fan is an indicator that is used to draw trend lines at specific angles according to high and low on the price chart in trading.
Although methods of applying Gann angles on the chart are still old but to use this method with a confluence to increase the winning probability will be discussed in this article.
What is Gann Fan?
Gann fan predicts the diagonal support and resistance levels on the candlestick chart in technical analysis. Because lines are drawn at some angles that is why it represents diagonal support and resistance.
Gann fan angles use two dimensions
- Price
- Time
There are three main angles 1X2, 1X1, and 2X1 that can be used to have an overview of the market with the Gann box indicator.
Upward angles identify support levels and downward angles predict resistance levels. The best thing about Gann fan angles, you can predict the upcoming support or resistance level with respect to time. for example, you can predict using Gann angles that after 3 days, a strong support level will come in the EURUSD currency pair.
Both time and price are relative in this tool, and you can predict price with respect to time and time with respect to price. For example, if the price is respecting a trendline with a 45-degree angle then after its breakout it will move on to the next angle like an angle of 35 degrees. Then it will start respecting this angle. This is how Gann fan angles work.
If the price is respecting one Gann angle, then after the breakout of this angle it will start respecting the next one. Angle number represents the strength of a trend.
- Higher angle means strong trend
- Lower angle means weak trend
How to draw Gann fan angles in forex?
To draw a Gann fan, drag the tool from swing low to swing high for a bullish trend. For a bearish trend, drag the Gann tool from swing high to swing low point on the price chart.
Use a Gann fan indicator is very simple. For example, if the price takes more time to rise then the slope of the price will be less steep and it represents a weak trend (by taking origin as a reference point). 1:1 in Gann means that Gann angle is 45 degrees. Above 45 degrees means a stronger trend and below 45 degrees means a weak trend.
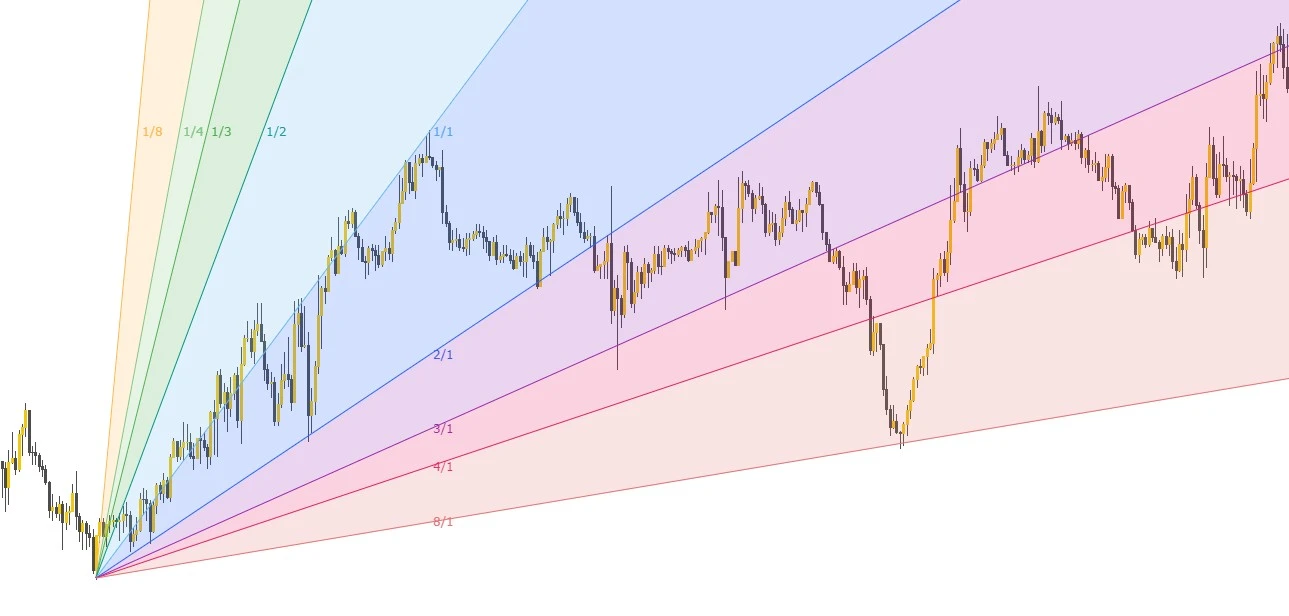
Important ratios in Gann fan are 1:1, 1:2, 1:4, 1:8, 2:1, 3:1, 4:1 and 8:1. 1:1 is the ratio for middle angle in gann fan tool.
Look at the image below. price is respecting the angles.
How to calculate Gann fan angles?
There are 9 angles in the Gann fan tool that acts ac diagonal support or resistance levels on the price chart. These nine angles are at certain ratios made by Gann. Each ratio represents a specific angle of the trend line. These lines are used to predict the price on the chart with respect to time.
Gann fan angles are calculated in the table below
| Fan Ratios | Angle in Degrees |
|---|---|
| 1×8 | 82.5 |
| 1×4 | 75 |
| 1×3 | 71.2 |
| 1×2 | 63.7 |
| 1×1 | 45 |
| 2×1 | 26.2 |
| 3×1 | 18.7 |
| 4×1 | 15 |
| 8×1 | 7.5 |
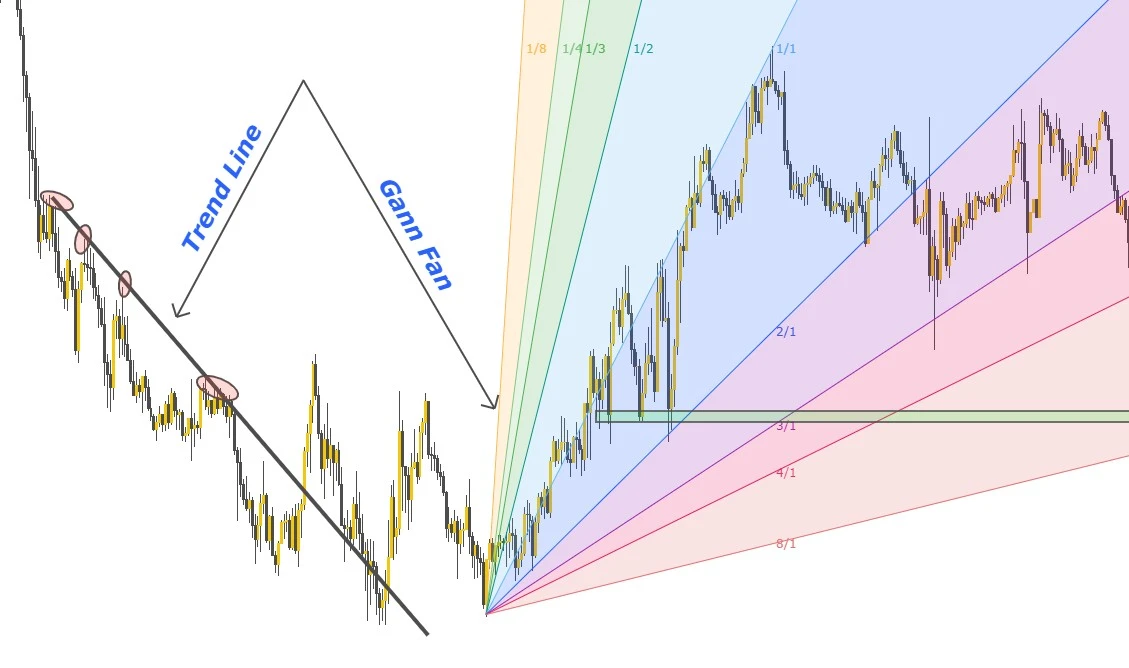
Gann Fan vs Trend Lines
Difference
Trend lines are basically drawn by connecting the swing low or swing high points in a trending market whereas Gann fan angles progress with the uniform speed with respect to time. That is why a trader can forecast easily an upcoming date using Gann angles.
Similarity
The similarity between trend line and Gann angles is that both work as a diagonal support and resistance level and after breakout price changes trend.
If both trend line and fan angle are intersecting at some point, then that point can act as a strong support and resistance level in the future but before the breakout of the trend line. After trend line breakout it will not remain valid.
What is Gann 50 Retracement Rule?
According to the Gann rule, if a currency pair or stock moves 100% in a direction in a specific time interval then for the next time interval it will come back or retrace 50% of the previous move. Like after movement of GOLD from $1100 to $1200 within two days then it will retrace to $1150 within the next two days.
Gann fan and fibonacci trading strategy
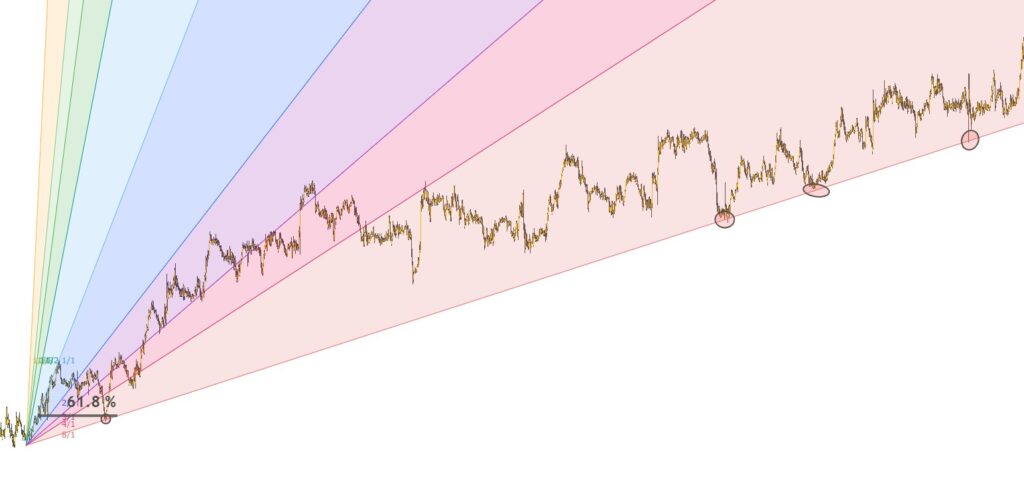
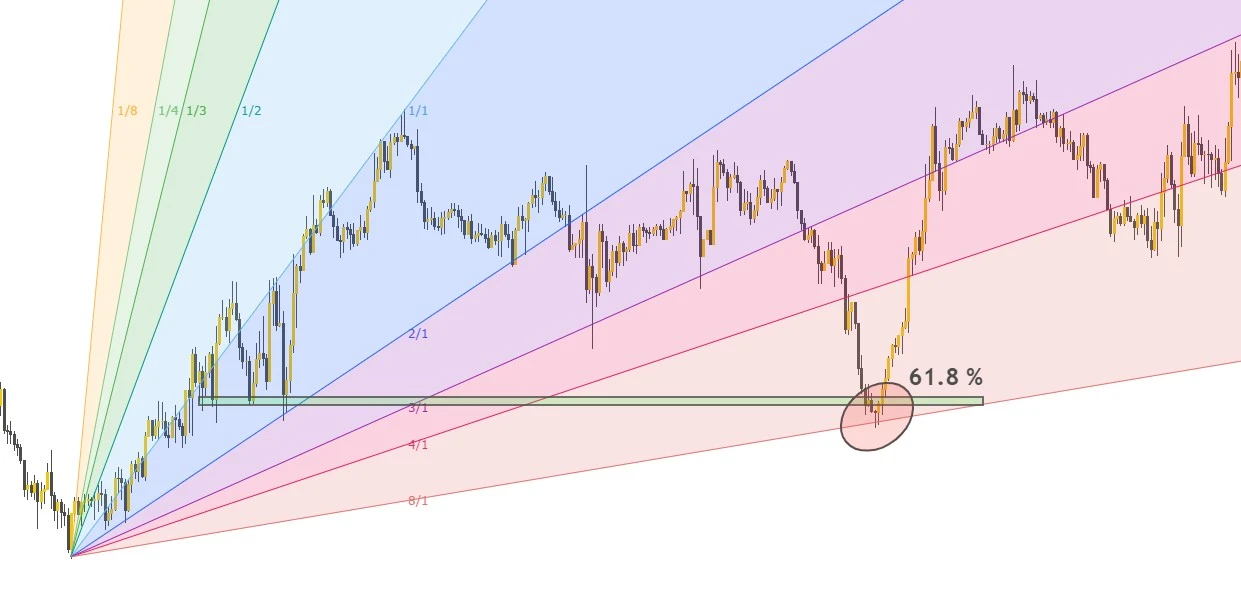
Using a Fibonacci as a confluence with Gann fan angles will help us find out strong angles. For example, draw Gann’s angle from swing low to swing high. Use all the possible fan angles. Now Draw Fibonacci from swing low to swing high point and highlight the 61.8% level.
if one of the Gann angles below 1:1 is coinciding with the Fibonacci 61.8% then it will act as a strong support zone or level. We will prefer to buy from this zone after bullish candlestick confirmation. This is the simple strategy to draw the strongest and trade-able zones while using Gann and Fibonacci tools.
Always Trade with Confluence
forexbee
I hope you will like this Article. For any Questions Comment below, also share by below links. Tradingview is the best chart tool
Note: All the viewpoints here are according to the rules of technical analysis and for educational purposes only. we are not responsible for any type of loss in forex trading.