
W.D. Gann invented the Gann square of 9 by using natural phenomena and numbers. Gann square trading has always been the best method to do technical analysis in the forex market. A lot has been changed in the past two decades, but the Gann tool is still being used by a lot of traders to forecast the market.
Gann square of nine
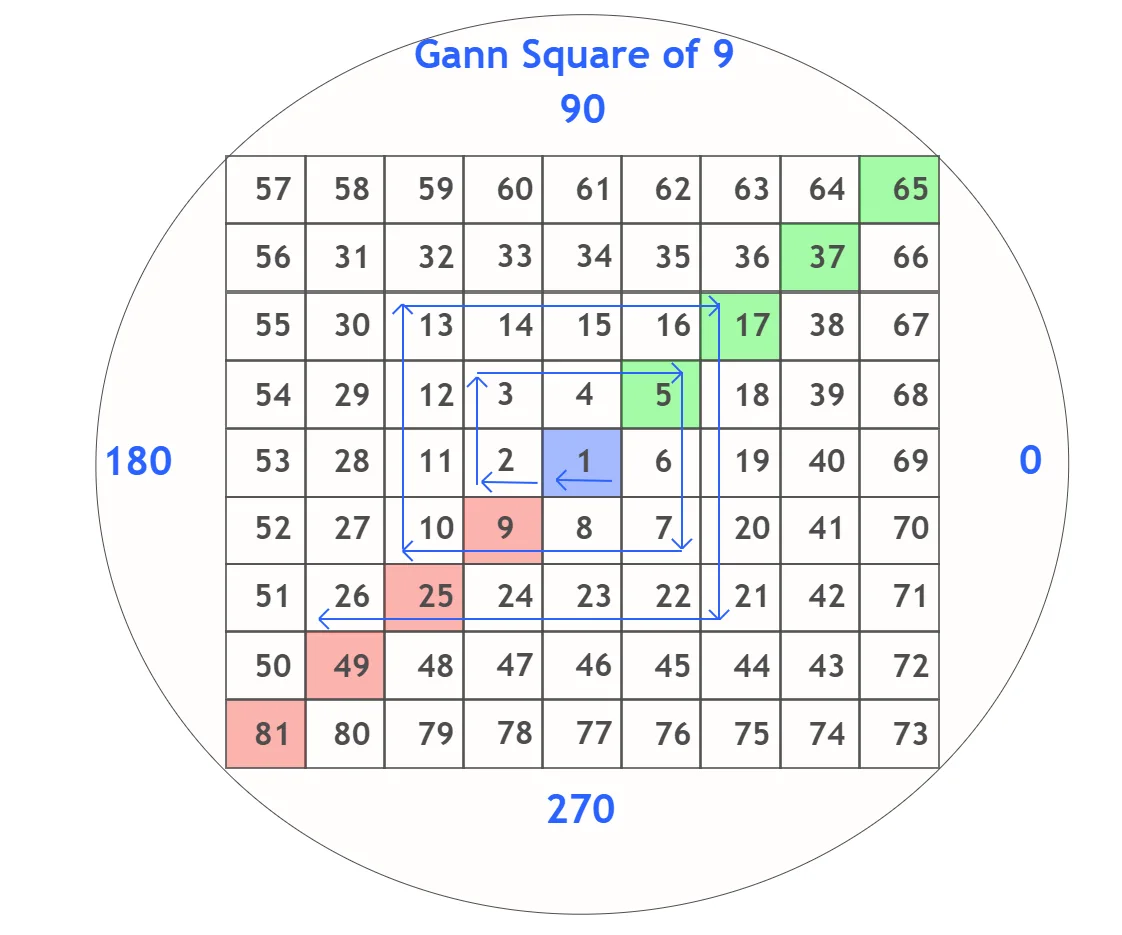
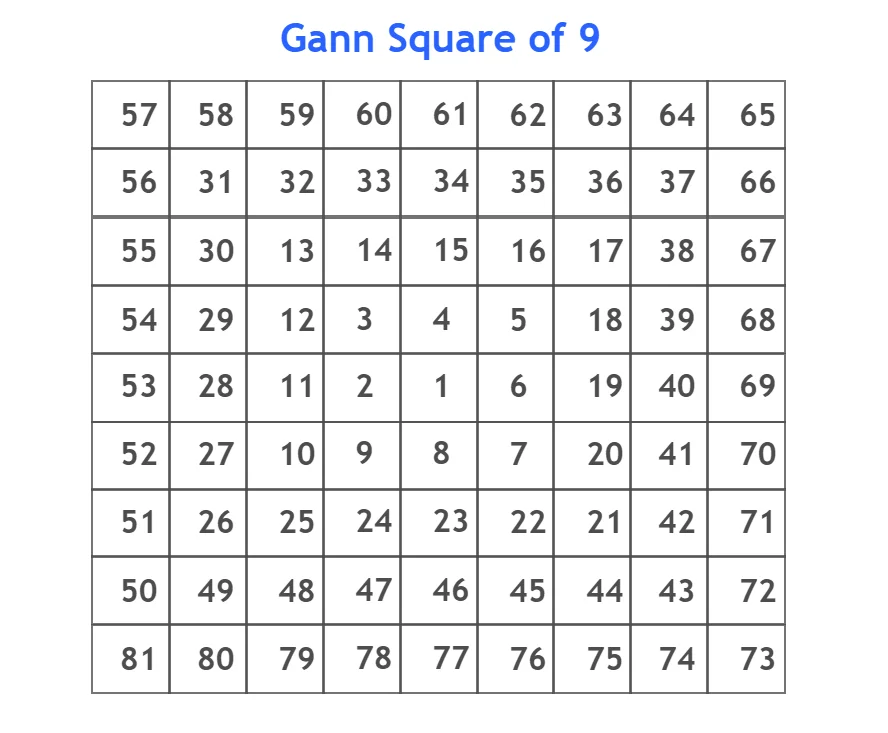
Gann square of nine is the Spiral of numbers starting from 1 in a square of nine rows and nine columns. The spiral progress in a clockwise direction from 1 to onward.

Gann Theory
A theory proposed by WD Gann in which technical analysis is based on the geometry of the price and time is called Gann theory. He uses both time and price to make this tool. This theory is also based on natural patterns and mathematical formulas. Gann square is a natural square calculator.
Basically, the Gann angles are the key concepts in this theory.
Create Gann square chart of 9
- Create a table of nine columns and nine rows. It will form a shape of square
- Add number 1 in the middle cell of square
- Now start writing numbers from 2 to onward in clockwise direction in the form of spiral
The total number in the Gann square chart of nine will be 81 because it is a square of nine.
Forecast numbers using Gann square
The most important thing in Gann square is that you can forecast upcoming numbers by using a simple formula. For example, you can forecast the next support or resistance price level using Gann square in trading.
In Gann square of 9, the number next to 28 is 53. If a stock price is at 28 and it is a resistance level then, you can forecast the next resistance level to be 53.
Follow the procedure to predict number 53 from 28 in Gann square of nine.
- Take square root of 28 that is 5.29
- Add 2 in 5.29 that is 7.29
- The square of 7.29 is 53 (round off)
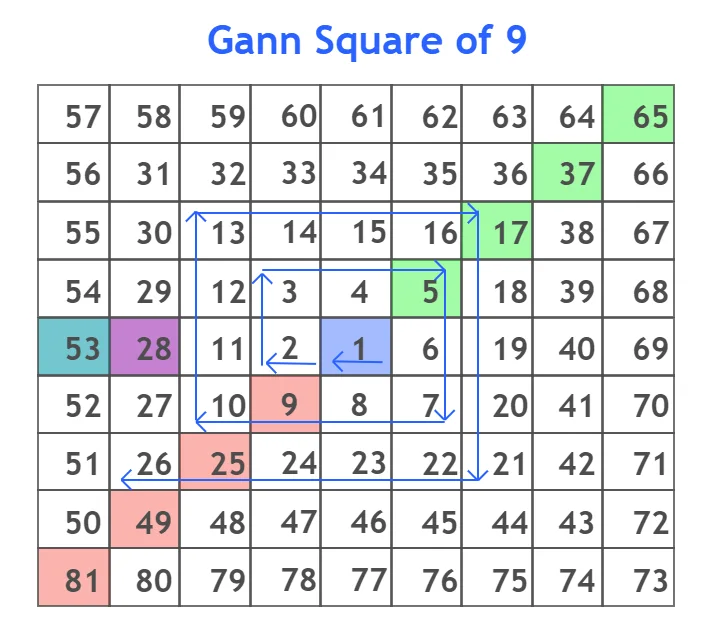
This is the beauty of math that W.D. Gann used in his Gann square method. The addition of 2 in the square root of 28 is due to 360 degrees rotation of the next number. Because 53 will be formed after 360 degrees rotation of spiral loop. For 180 degrees you will add 1.
How to apply Gann square of nine?
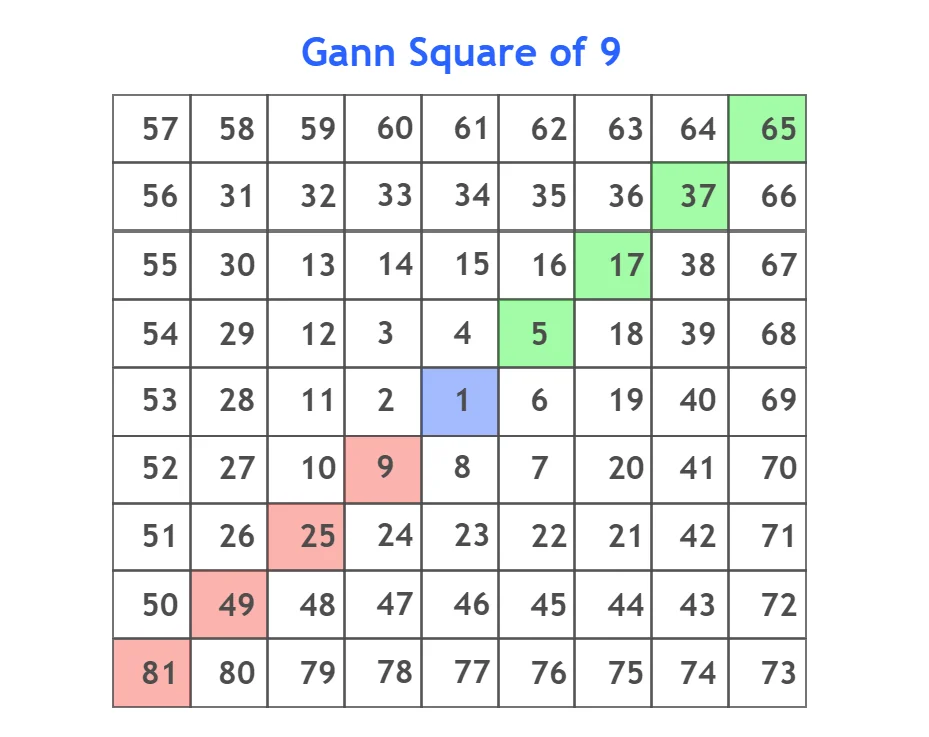
Gann square of nine gives important numbers that can act as support or resistance price levels in trading. W.D. Gann categorizes the square of numbers into diagonals based on degrees. The degree of angle represents the time.
The degree or angle also reveals that how much time the market will take to come to a specific price. Analyze the below table of numbers with respect to degrees.
The most valuable numbers are at 45 degrees and 225 degrees. For example, if 9 is a support level of stock then, 17 will be the upcoming resistance level. This is how it works.
Compare each square loop of Gann square with each wave of price on the chart and then you will be able to understand it.
What is Gann Box, Gann Box Square, and Gann Box Square Fixed?
Gann box is used to find out repetitive cycles of price with equal intervals of time. Draw Gann box from swing high to low or swing low to the high point. Modify the Gann box easily without square restriction. But on the other hand, Gann box square has a 1:1 relationship between time and price.
Always remember to keep your layout square means slope between price height and time must be 45 degrees.
Gann box square fixed is used to fix this tool on the chart layout and it will not shift its layout.
Conclusion
The best thing about Gann square of nine is that this tool forecasts the price with the proper time. in price action trading, you don’t know about the time and how much time the price will take to achieve a target price. But Gann square will forecast both time and price. This makes it the best forecasting tool.
Most of the traders don’t know about the Gann square of 9 due to lack of popularity.