
What is Gartley Pattern in trading
The Gartley pattern is a type of harmonic pattern that is recognized on the chart by using fixed Fibonacci ratios in trading.
It is the most widely used harmonic pattern in forex technical analysis. It is a natural pattern that shows retracement and impulsive moves. Due to the use of the Fibonacci tool, most technical analysts take interest in this pattern to use it for trading.
Fibonacci is a natural tool. Everything in nature follows a certain kind of pattern. That’s why it is logical to use the Gartley pattern to forecast the market.
Types of Gartley pattern
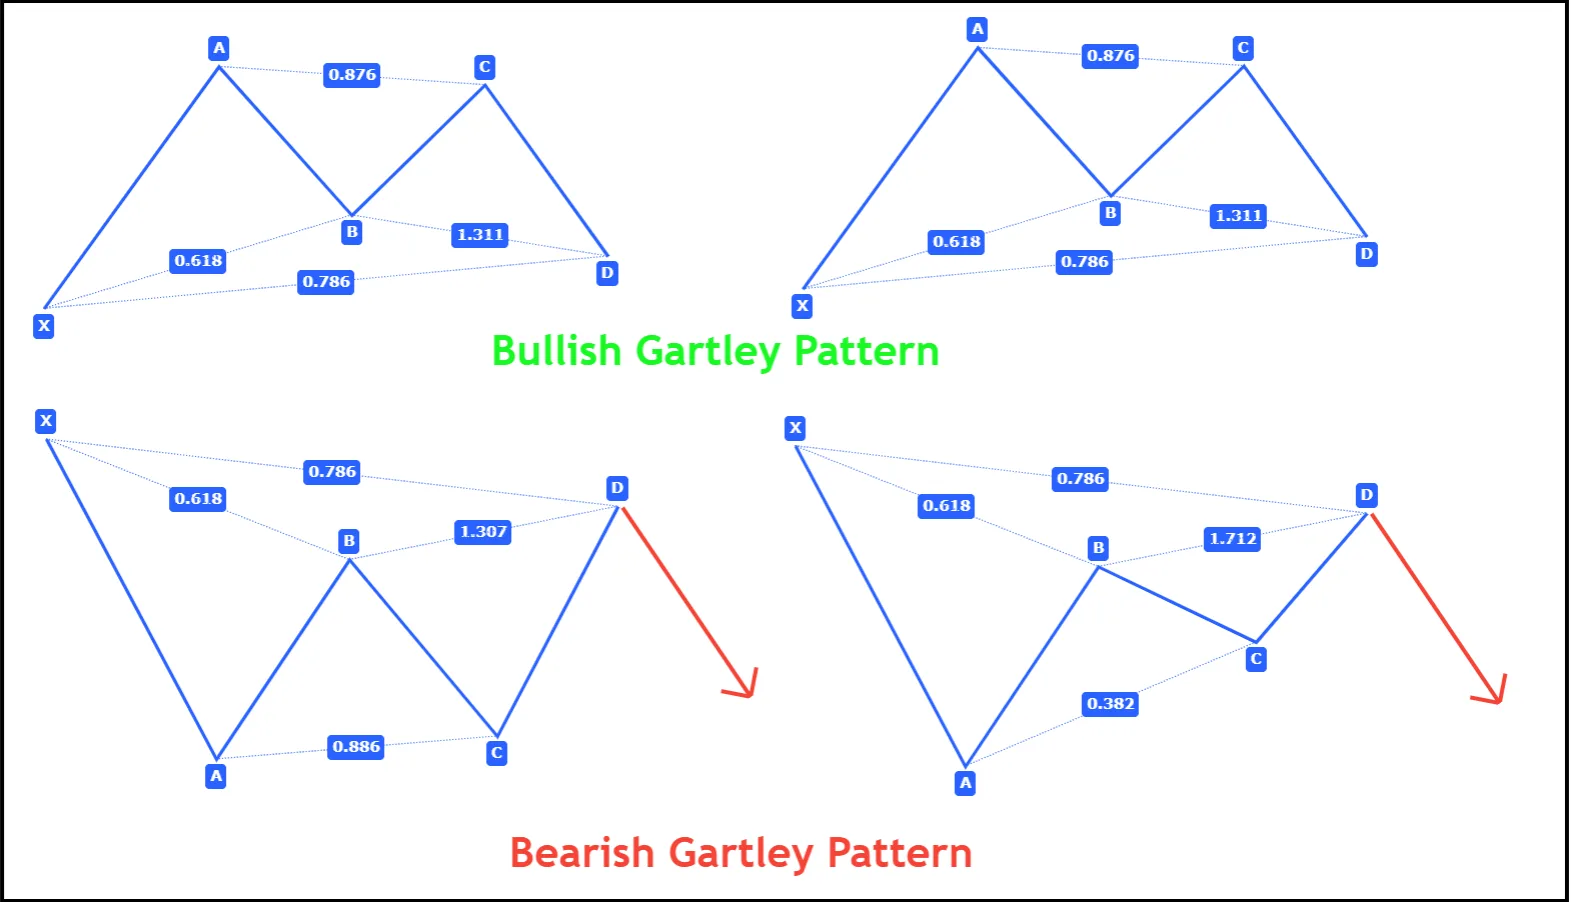
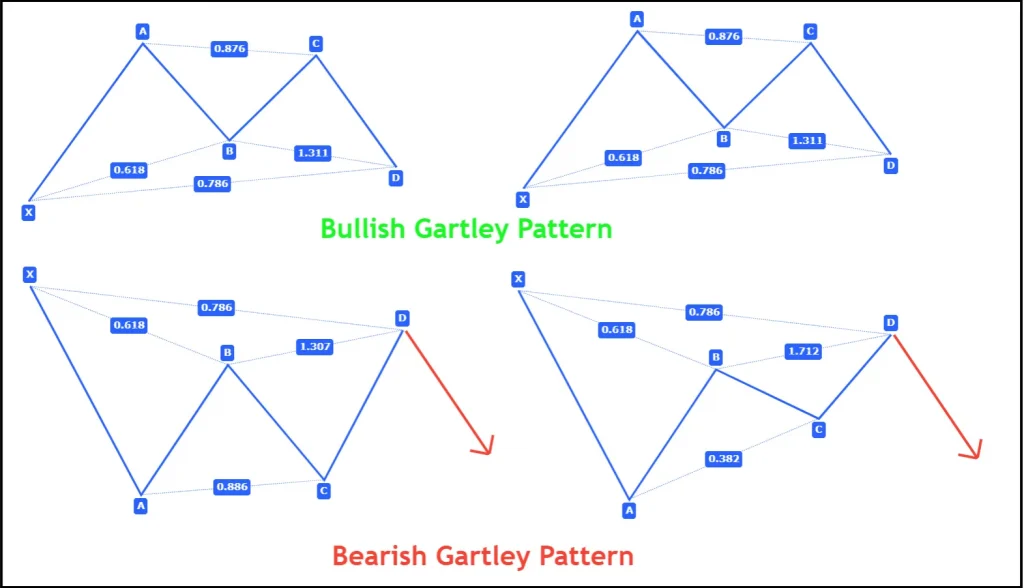
The Gartley pattern is further categorized into two types based on the direction of the market.
- Bullish Gartley Pattern
- Bearish Gartley Pattern
How to find out Gartley Pattern?
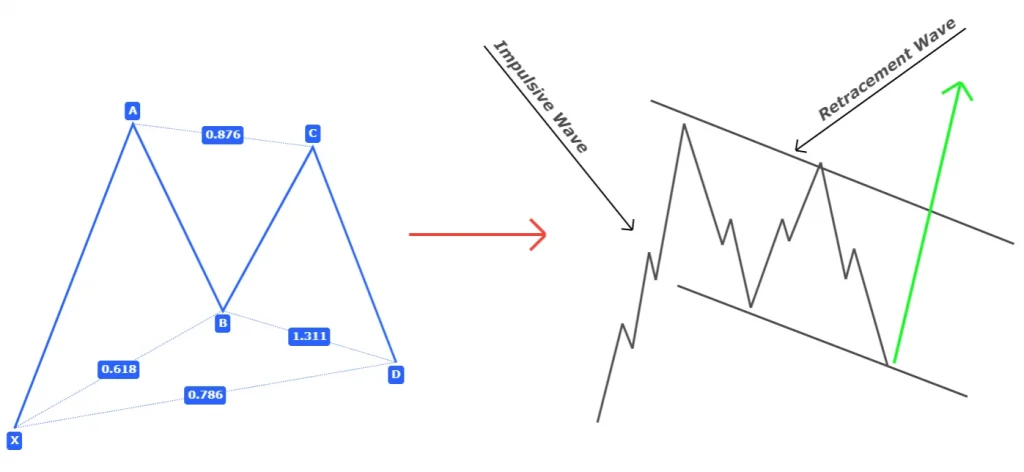
Gartley Pattern consists of four waves in which one wave is an impulsive wave and the other three waves make a retracement structure of this pattern.
Remember, you should try to find out the five points XABCD instead of calculating waves. I have used the word “wave” for you to make things clear.
Each point in the Gartley pattern must be at some Fibonacci level. If a single point is not following the Fibonacci rule, then you should avoid that setup.
Two winning trades are better than 10 losing trades.
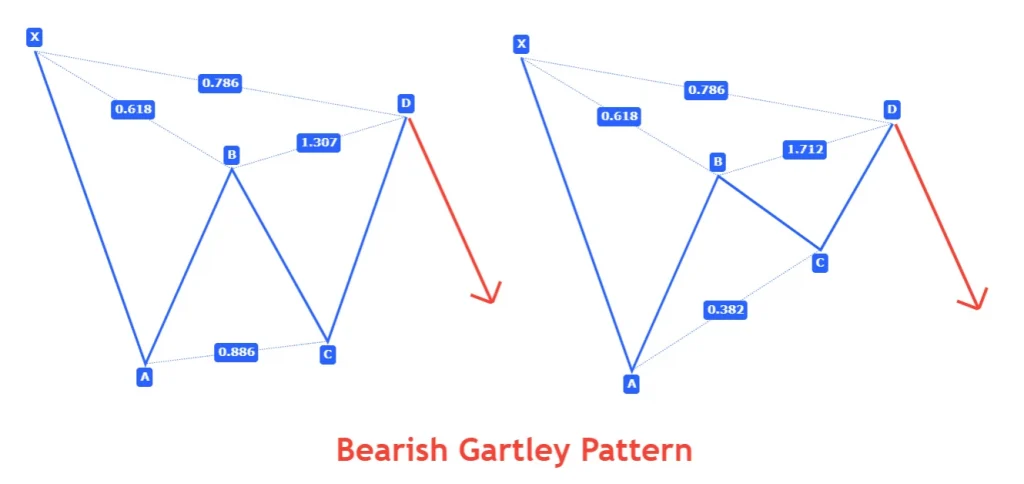
Rules to recognize bearish Gartley Pattern
Bearish Gartley Pattern consists of five pints XABCD. It represents the start of a new bearish trend.
Remember that you should try to find out the bearish pattern at the top of the uptrend or in the overbought conditions.
Follow the following rules based on Fibonacci to identify the bearish Gartley pattern
- X is the initial point, and it meets point A. X must be at the top of pattern in case of bearish pattern
- AB wave must retrace to 61.8% Fibonacci level of XA wave.
- BC wave must retrace to 88.6% or 38.2% Fibonacci level of AB wave. There is an option either it can retrace to 88.6% level or to 38.2% level. But both options will be true.
- The last and final wave of Gartley Pattern, CD wave, must retrace to 78.6% Fibonacci level of XA wave.
These are the four steps; you must follow to find this pattern on the chart. If Any of the above steps is failing the please avoid that setup.
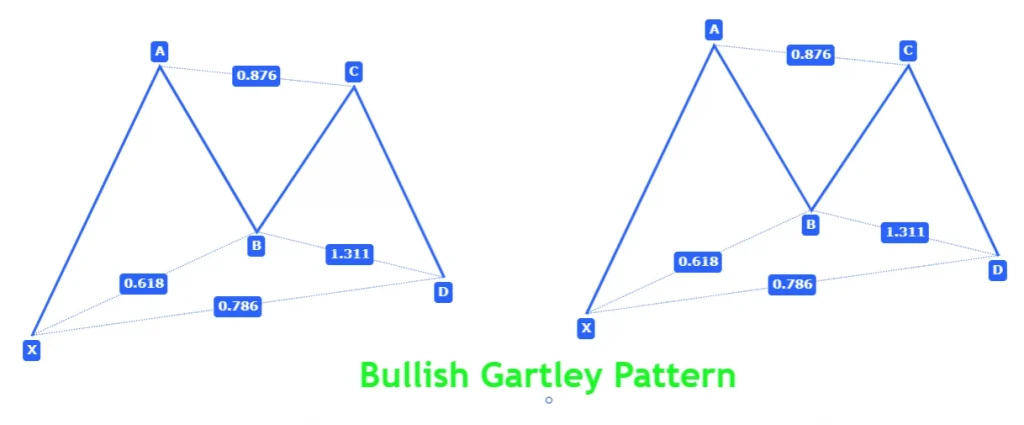
Rules to recognize bullish Gartley Pattern
It indicates that a new bullish trend is about to start. It consists of five points like a bearish pattern, but the difference is the location of each point.
Remember that you should try to find bullish Gartley patterns in the bottom or in oversold conditions to get a high probability pattern.
Follow the following criteria to identify a bullish Gartley Pattern
- X is the initial point, and it is the lowest point of this pattern
- AB wave must retrace to 61.8% of XA wave in bearish direction
- BC wave must retrace to either 88.6% or 38.2% Fibonacci level of AB wave
- CD wave retraces to 78.6% Fibonacci level of XA wave in bullish Gartley pattern
What does Gartley Pattern signify?
It signifies the completion of a wave and the start of the next wave. If you can look at this pattern like a professional trader, then you will see two main waves.
- Impulsive wave
- Retracement wave
XA wave is an impulsive wave and AD is a retracement wave. The first wave represents impulsive and the next three waves represent retracement in the market. Look in the image below for a better understanding.
This structure of this pattern shows that it is logical to trade this pattern. After understanding the basics, you will be able to identify this pattern correctly on the chart.
Trading plan for Gartley Pattern
After identifying the harmonic chart pattern, the next step is to look for a trading plan. Without a proper trading plan, you will end up in losses.
Because if you don’t know where or when to open or exit a trade, then you will do it randomly. And this is not a way to do technical analysis.
To make a trading plan, you must answer these questions to yourself.
- Where to find a chart pattern?
- When to open a trade?
- When to exit a trade?
- Where to put a safe stop loss?
- What risk reward ratio size you should choose?
When you will answer all the above questions, then you are good to trade on a live account or practice on a demo account.
Things to remember
You must check the location of each pattern on the chart to filter out good chart patterns.
For example, you should look for a bullish Gartley Pattern at the bottom of a trend. You should avoid bullish chart patterns if the market is already in an overbought condition. And avoid trading bearish chart patterns if the market is in an oversold condition. Because there are more chances of reversal in an overbought or oversold condition.
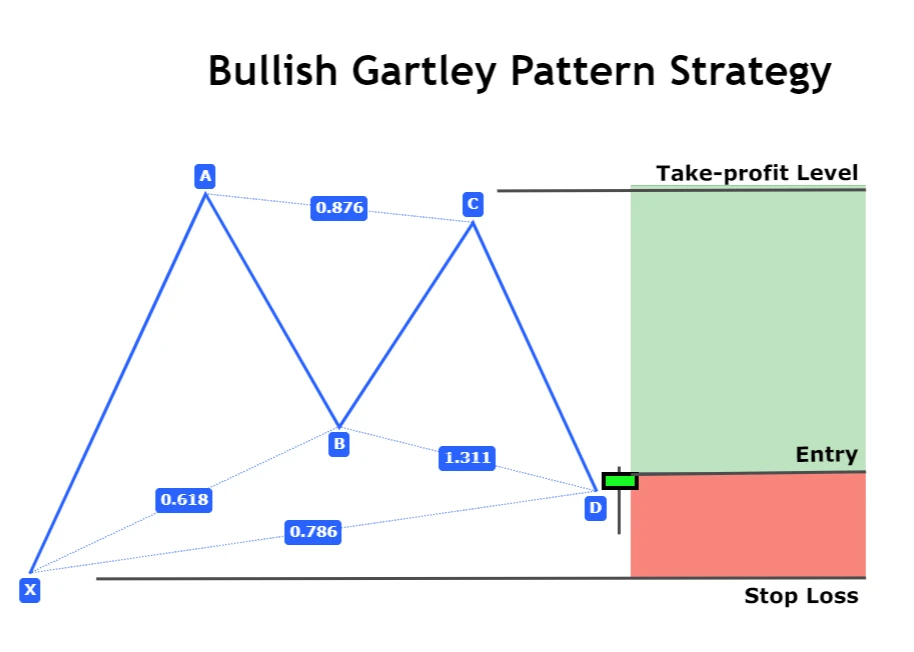
Open a trade
When the pattern will complete at point D, then wait for the formation of a candlestick pattern. A candlestick pattern will confirm the direction of the trade and it allows you to wait until trend reversal.
Open a trade just after candlestick pattern (Pin bar, engulfing candlestick, three inside up / down) confirmation.
Stop-loss level
There are two choices to find a stop-loss level.
In case, if wave CD retraces to 78.6% Fibonacci level, then stop loss will be above/below the point X.
If wave CD retraces to 38.2% Fibonacci level, then stop loss level will be few pips above/below the candlestick pattern
Take-Profit level
Point A is a price level that will act as a take profit level. But you can extend the take-profit level using the 1.618 Fibonacci extension level of the XA wave. This will increase your risk-reward ratio.
Timeframe
The best timeframes to trade harmonic patterns are 15 minutes to 4 hours for swing and intraday traders.
Conclusion
Gartley is the most widely traded harmonic pattern but due to Fibonacci restrictions, you will not be able to get this pattern more frequently than other chart patterns. But you should not miss a trade opportunity once you identified this chart pattern in a currency pair or cryptocurrency.