
In this article, you will learn the best and only one harmonic Bat pattern in forex technical analysis. I will not complicate things but I will teach here a perfect Bat pattern everyone should look for. Instead of trading just one harmonic pattern and focusing on just a single strategy, every retail trader is learning many strategies and skipping strategies one after one. The fault is not in your strategy but the fault is in way of trading everyone following. According to my experience, the harmonic bat pattern is perfect and easy to follow. I will use supply and demand techniques as well as Fibonacci with bat pattern to make it a perfect and high-risk reward setup.
What’s Bat Pattern in forex?
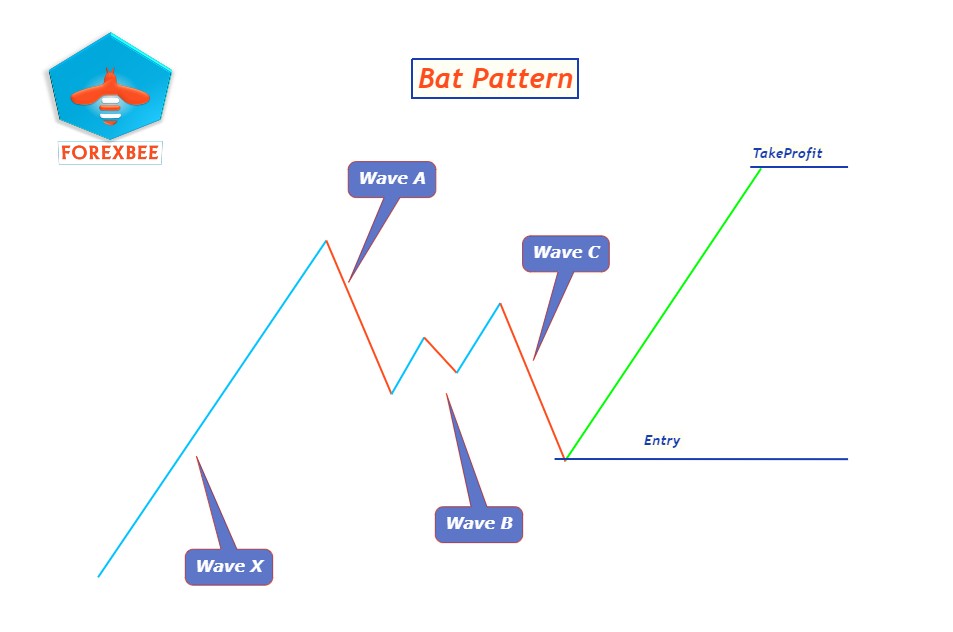
Bat pattern is a type of harmonic pattern which consists of five waves XABCD. Wave X represents an impulsive move by price and ABC wave represents retracement in the price and then wave D again represents an impulsive move in price by institutional traders. There are different rules for bullish bat harmonic pattern and bearish bat harmonic pattern and you will learn in detail.
Wave Analysis of Bat Pattern
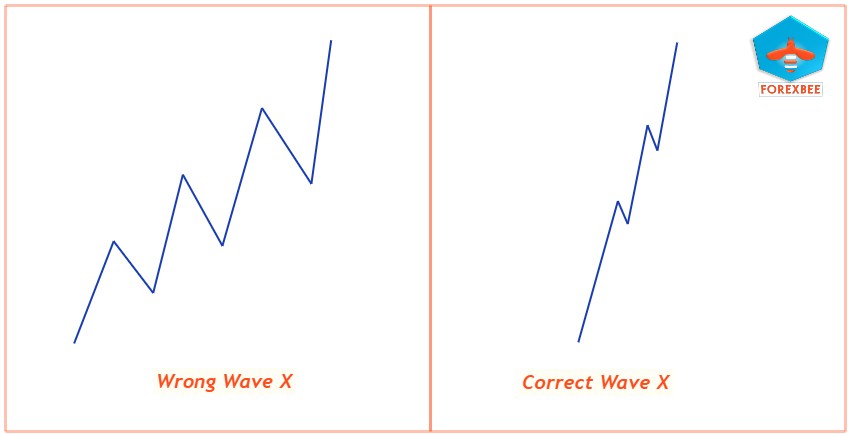
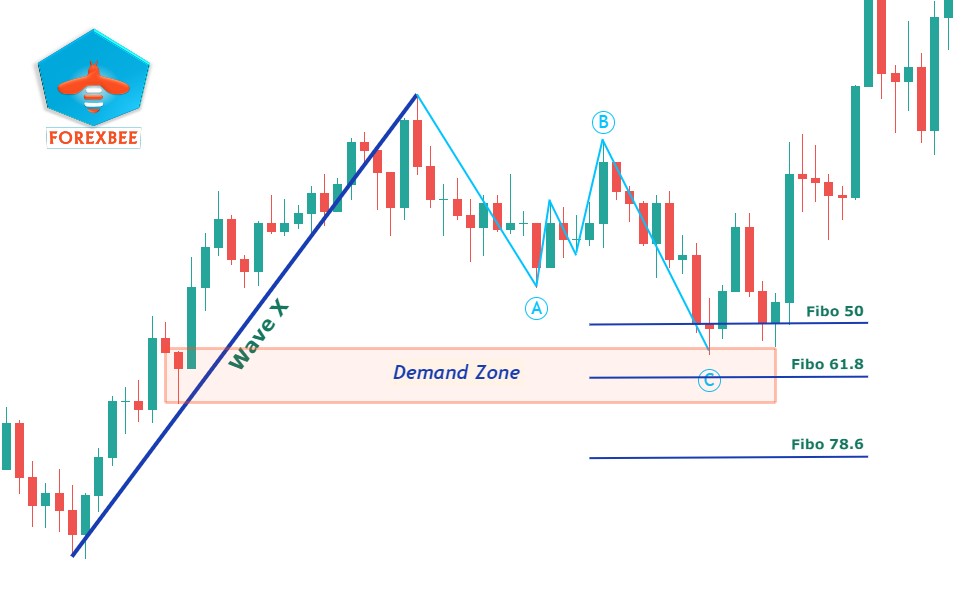
The first step in the bat pattern is to recognize only the perfect pattern. We will skip setup which is not perfect because every pattern looking like a bat pattern is not a bat pattern. We will not apply XABCD wave everywhere on the chart but only on perfect and setup which will approach to ideal setup. I will explain with an example and will post the ideal setup along with a live example. See in the chart below that wave X is a straight one. I mean this is just one wave not many waves in a single move. I want to say that there can be many waves in a single move by the price and we will skip a setup that has many waves in a single move. We are just focusing on a single X wave in a single move by the market. See the difference in the chart below which one is the perfect X wave and which one is not the correct wave.
Now after recognizing X wave we will come to the next ABC Pattern. Here same rules will be applied. Like in wave A there must be a single wave in a single move by the price. Next after wave A, there will be retracement by the price which will be called wave B. in wave B, there are further three waves A, B and C. Retracement move by the market is of minor importance we will not focus too much on this wave. After Wave B, the price will progress making a final wave C of the pattern. The same rules will be applied to wave C. I meant to say there must be a single wave C in a single move by the price. Another important rule of bat pattern is that wave A must be approximately equal to Wave C. Wave analysis of Bat pattern is completed.
Supply and Demand Zone from Wave X
To pick a pinpoint entry or to get a high risk-reward ratio, Supply and demand is necessary in forex technical analysis. Supply and Demand zones give us information about the location of pending orders by institutional traders. I will not teach here about Supply and Demand in detail. To learn click here.
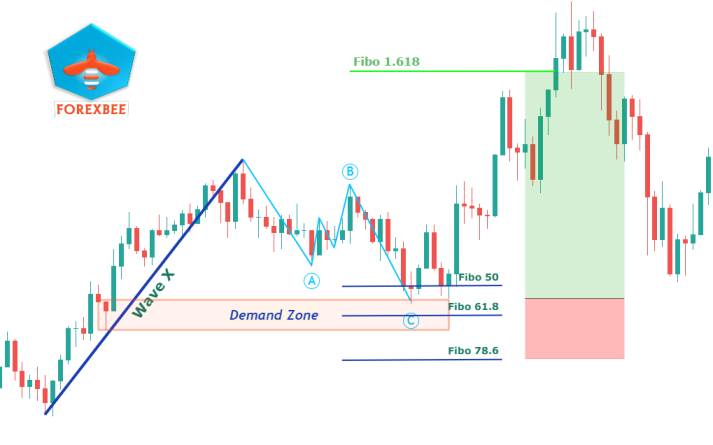
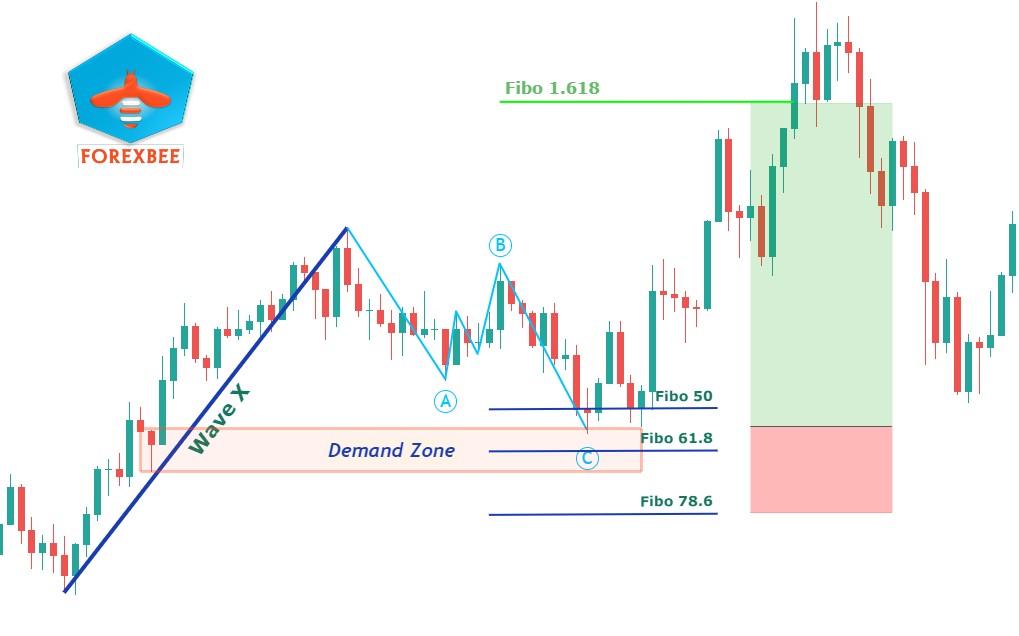
The next step after wave analysis is to draw a demand or supply zone and this zone must be between Fibonacci 50, 61.8, and 78 level. If the Demand or Supply Zone is fresh then well and good. SnD zone will always give us an entry price. Remember to include spread when placing a pending order above or below the SnD zone. SnD refers to Supply and Demand.
Use of Fibonacci in Bat Pattern
The use of Fibonacci in bat patterns is the final step. Fibonacci is used to getting the target price (take profit price) and Stoploss price. To learn abbot Fibonacci target click here because target price depends on price retracement and I have already explained. Stoploss can be placed below or above the Demand or Supply zone respectively. This is an aggressive setup but will give a high risk-reward like 1:8, 1:10, or more. The safe stop-loss level is always below Fibonacci 78 level in the case of the Bat pattern. And it depends on the situation if you can afford aggressive stop loss then go with it and pick High RR otherwise stick to the rules. The final setup is below in the image.
Everything I explained above is according to fix rules to minimize psychological issues. No hit and trial method. This is a winning setup with proper confluence, not a simple website article written by writers, not traders. I don’t hire a writer to write articles for me who don’t even know about forex. Being a forex trader, I write articles on this website (forexbee) myself. Master price action trading with forexbee.
I fear not the man who has practiced 10,000 kicks once but i fear the man who has practiced One kick 10,000 times
I hope you will like this Article. For any Questions Comment below, also share by below links. Use Tradingview for technical analysis instead of mt4. Join Telegram to get trade ideas free.
Thanks
Note: All the viewpoints here are according to the rules of technical analysis. we are not responsible for any type of loss in forex trading.
Thanks a million ❤
I liked
Thanks more than million
I wish there is an option for download in PDF