
Like other harmonic patterns, the shark pattern is also famous not because of its name but also due to its profitability ratio.
This pattern is made by specifying Fibonacci parameters. Fibonacci is an essential element of all the harmonic patterns like in shark patterns. You are not going to find out the exact shark on a candlestick chart, but you will follow Fibonacci parameters for each wave of shark pattern.
Is not it simple? Let’s start learning shark patterns in detail.
What is Shark Pattern in trading?
A shark pattern is a type of harmonic pattern that consists of five waves, and it is identified by following the specific Fibonacci ratios for each wave in trading. These ratios differentiate it from other harmonic patterns.
You need to understand the meaning of shark here in trading. A shark in real life means a big animal that eats small animals in a big sea. In trading, a shark means a big trader or big institutions eliminate small traders by stop-loss hunting in the big market.
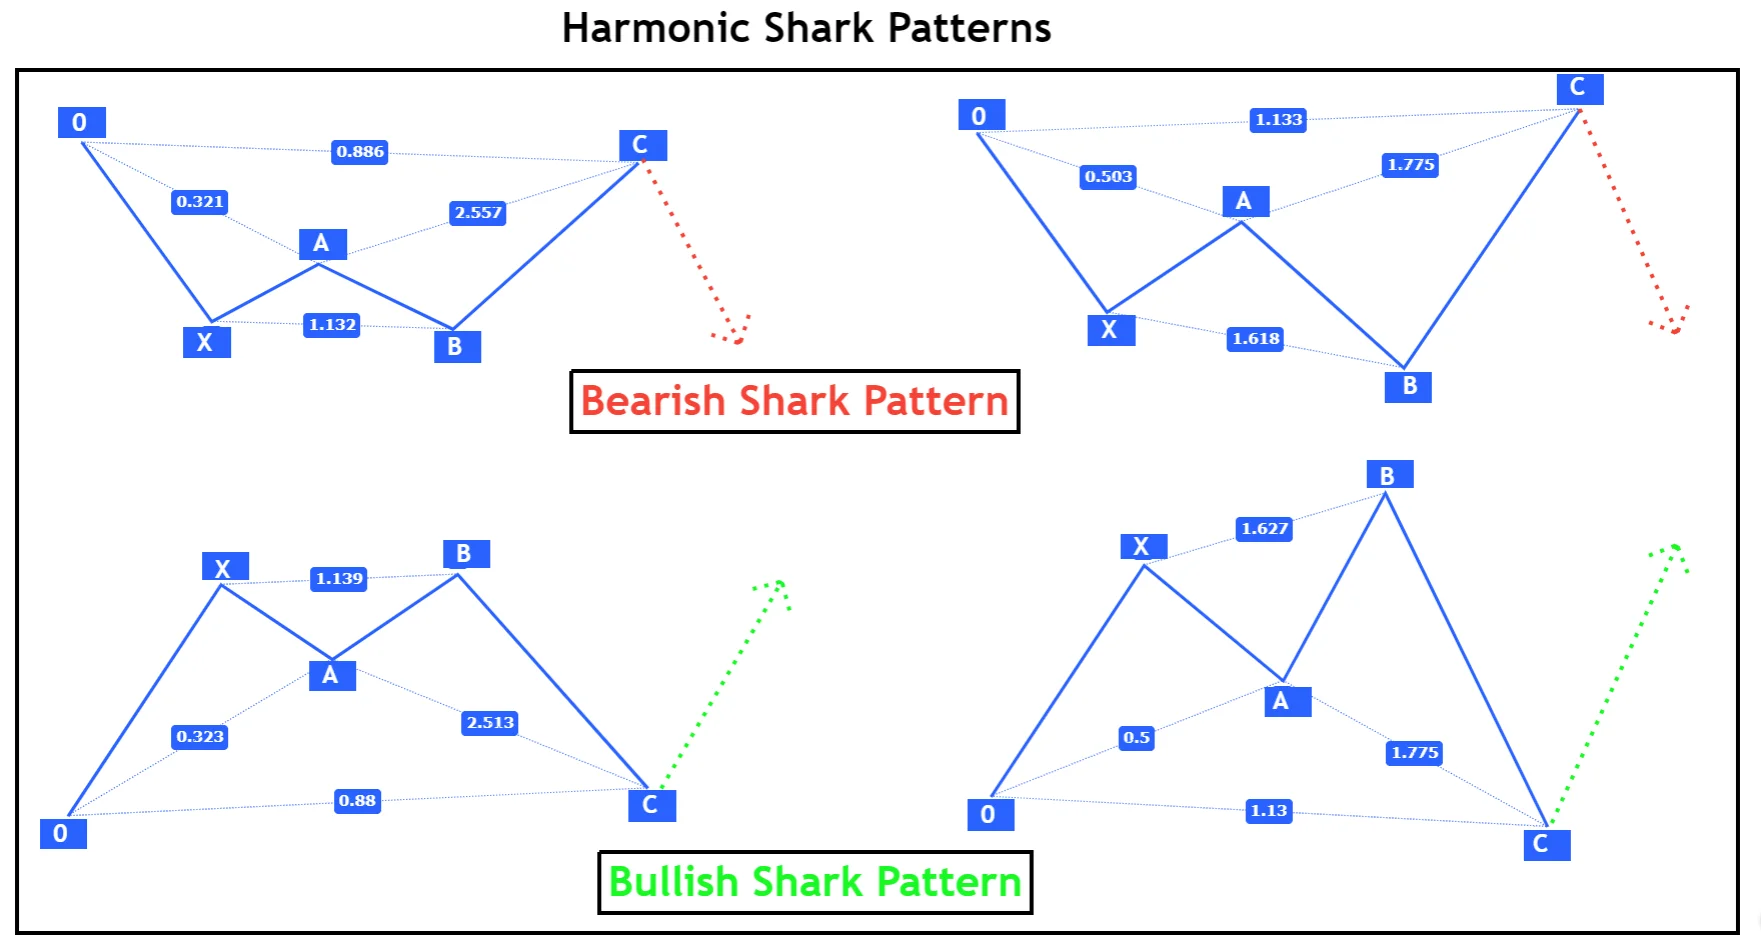
Types of shark pattern
In trading, the shark harmonic pattern is further divided into two types based on the direction of the market and Fibonacci ratios
- Bullish shark pattern
- Bearish shark pattern

How to find out Shark pattern?
Harmonic shark pattern starts with point 0 and ends at point C. 0XABC represents five points of shark pattern. Each wave has a fixed Fibonacci ratio. If any single wave is not following specific Fibonacci ratios, then we will avoid that setup.
Waiting for a perfect setup is important than trading irregular patterns that will impact the risk-reward ratio.
Let’s learn about the Fibonacci ratios for shark patterns.
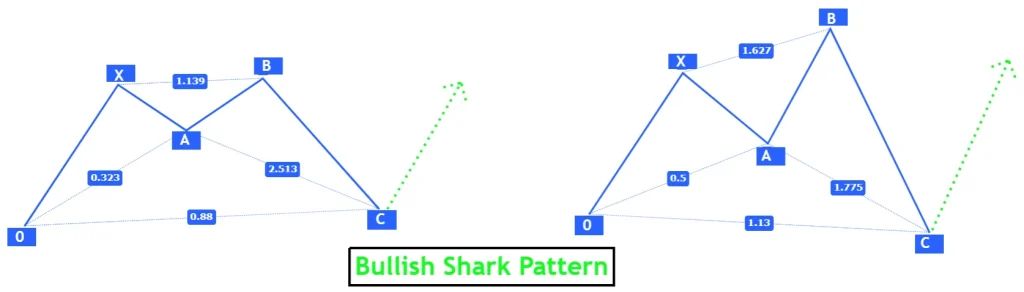
Rules to identify bullish shark pattern
As the name represents this pattern is forecasting the bullish direction of the market. Follow the following criteria to identify a bullish shark pattern on the chart in technical analysis.
- 0 to X is initial wave and patterns starts here. X must be higher than 0
- X to A is second wave and it must retrace to 0.32-0.5 Fibonacci levels
- B point must lie between 1.13-1.618 Fibonacci extension levels of XA wave
- C point must lie between 1.618-2.24 Fibonacci extension levels of AB wave. It is the final point of bullish shark pattern
- 0 point should lie between 1.13-0.86 Fibonacci levels of 0B wave.
You need to follow these rules to find out bullish shark patterns in trading.
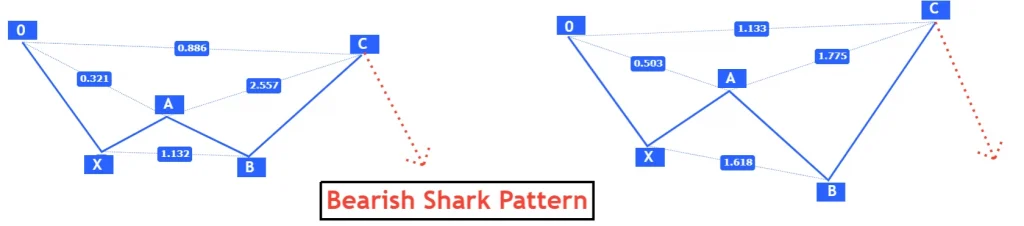
Rules to identify bearish shark pattern
The bearish pattern indicates the bearish direction of the market. It shows that bears are coming, and they will make the market go down.
Like the bullish patterns, you need to follow these Fibonacci ratios to find out the bearish shark pattern in trading.
- X point must be lower than 0. 0 is initial point of pattern.
- XA wave must retrace to 0.32-0.5 Fibonacci retracement levels.
- Point B must lie between 1.3-1.618 Fibonacci extension levels of XA wave
- C Point must be higher than 0 initial point and it must lie between 0.88-1.12 Fibonacci levels of 0B wave
What does shark pattern signify?
It is a stop-loss hunting pattern in the market. If you see this pattern with an eye of a professional trader, then you will see that market is breaking the important levels to capture stop losses of retail traders.
Let’s read the price action of this chart pattern.
Price starts from the initial point 0. Then price reverse from a point X and retraces to A point. Why price retraces from Point x? because it was an important resistance level. Then market reverses from point A due to more demand, breaks resistance X, and forms a point B.
Remember market breaks resistance and many retailers will buy here because of the breakout. By breaking point X, market hunt stop-losses of retailers that had put their stop loss above this resistance and trapped many buyers to open buy positions due to breakout.
Now price will turn and many retail buyers will lose hope. It will now break the demand level A and then point to zero. After the break of point zero, almost all retail buyers will close trades in loss, and they will tend to sell because of support level breakout.
But the market will now turn again and will choose a bullish direction. This is how market makers are trapping traders.
That is why it is a good harmonic chart pattern
Shark Pattern trading strategy?
There are many ways to trade shark patterns. You can also trade this chart pattern without any confluence, But I will recommend you to at least add a confluence of candlestick patterns.
Candlestick patterns tell a trader when to open a trade and when to wait for a trade opportunity.
For example, you found a bullish shark pattern on the chart but at point C there is not any bullish activity in candlesticks. Price is making large bearish candlesticks. Obviously, you should wait for any bullish sign to appear instead of just opening a buy trade blindly.
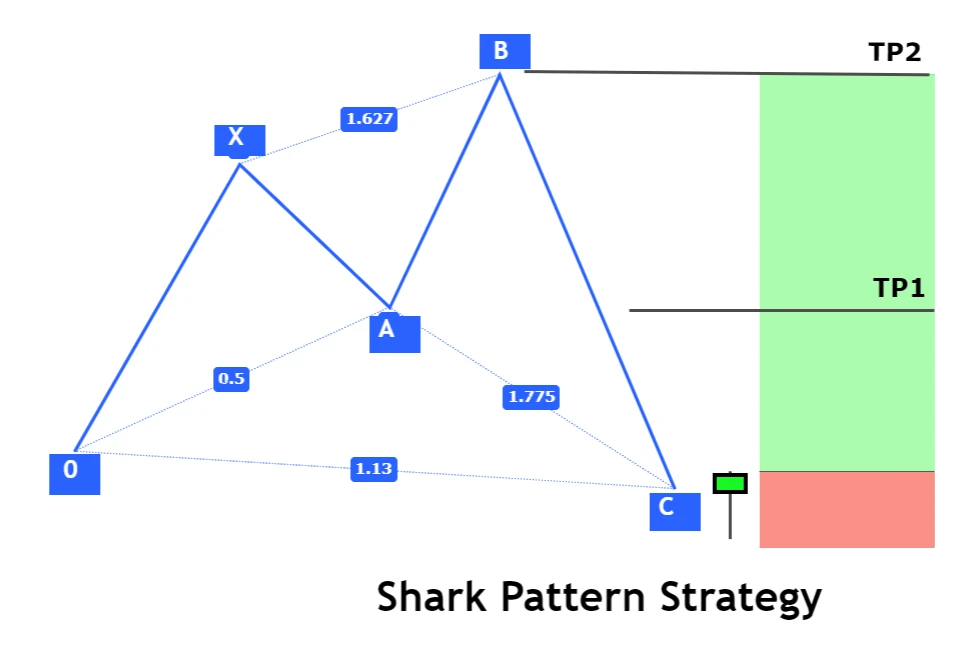
Open a Trade
When Point C forms and the bullish pattern completes, then wait for the formation of any bullish candlestick pattern like engulfing, three inside or pin bar. In the case of the bearish pattern, wait for a bearish candlestick pattern at point C.
Stop-loss level
The Stop-loss level will be a few pips below the candlestick pattern at point C, in the case of the bullish shark pattern. For the bearish shark, the stop loss level will be a few pips above the bearish candlestick pattern at point C.
Take-profit level
There are two take-profit levels to minimize the risk of loss. Take-profit 1 will be a price level of point A. Take-profit 2 will be at the price level of point B.
You need to break even the trade when the price achieves a price level of tp1.
This is a simple strategy to trade the harmonic patterns in trading.
Conclusion
The best stop-loss hunting pattern in harmonic patterns is the shark pattern. Harmonic patterns are the best and have a high accuracy of winning, but they are rare. You need to put a little more effort to identify these patterns on the chart because of Fibonacci ratios.
When you will backtest this pattern at least 100 times then you can figure out the harmonic pattern in a one-second view of the chart. The best timeframe to trade harmonic shark patterns is 15M to daily timeframe.
Backtest it and trade on the live account using a confluence of candlestick patterns.