

The Ichimoku cloud is a trading system that is based on moving averages to identify strong support resistance levels and trend reversal points.
The cloud in Ichimoku cloud represents the price trend either bullish or bearish. It has made it easy for retail traders to read the market by using the Ichimoku cloud. Because a simple moving average does not reveal much information about the price.
Ichimoku cloud indicator explanation
It consists of five moving average lines and each line has a specific function.
- Conversion line
- Base line
- Lagging line
- Leading line A
- Leading line B
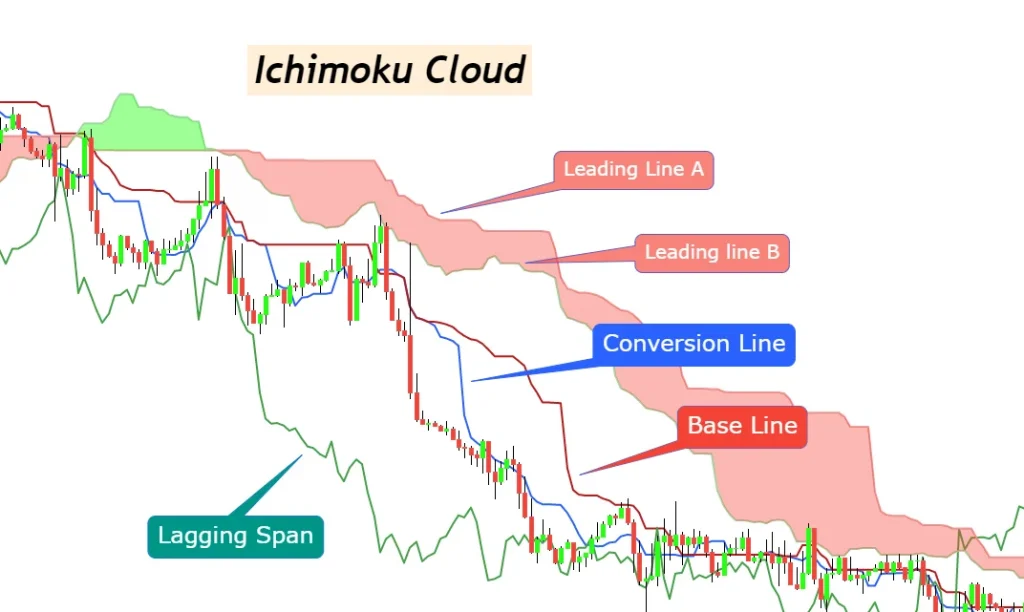
Conversion line
The conversion line is a 9 Period moving average line. It uses the data of the previous 9 candlesticks to determine the current average price.
Base line
The base line is a 26-period moving average line. It uses the data of the previous 26 candlesticks to determine the current price.
Lagging line
This line lags 26 candlesticks back the current price line. The deviation of this line represents the strength of a trend. It uses the closing prices of candlesticks.
Leading line A
Leading line A is the average of close line and base line. It is used as the boundary line of the cloud.
Leading line B
Leading line B is a 52-period moving average. It uses the data of the last 52 candlesticks and it is also used as the boundary line of the cloud.
How does Ichimoku cloud work?
The main feature of the Ichimoku cloud is to determine the trend. Cloud is formed by two lines leading line A and leading line B.
Bullish trend
If the leading line A is below the leading line B then the trend will be bullish.
Bearish trend
If the leading line A is above the leading line B then the trend will be bearish.
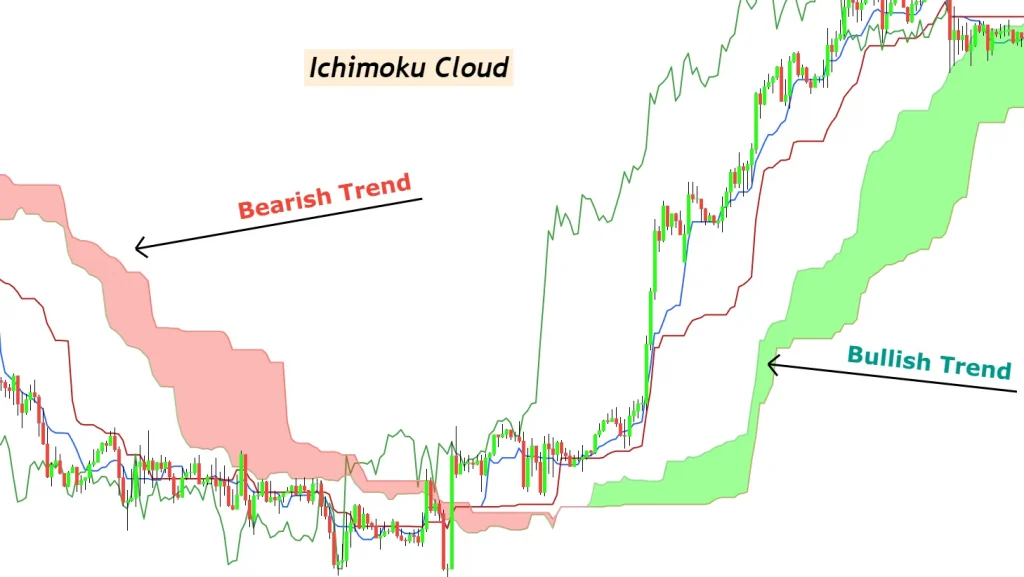
Pro-Tip: The difference between these two lines indicates the strength of the trend. The bigger difference means a strong price trend and a smaller difference means a weak price trend.
Working of Ichimoku Cloud indicator
It looks difficult to understand but it is quite easy. You just need to learn this indicator part by part. Each moving average line is used for a specific purpose. By combining the confirmations of all the five indicators, you will get a clear idea of the market.
we will divide this Ichimoku cloud indicator into three parts to make it easy to understand.
Part A
We will cover Base and conversion MA lines in part A. base line is a fast-moving average line. It shows us that how fast the price is moving upward or downward. If the price is holding base line, then it means the trend is extremely bullish or bearish.
A conversion line is a slow-moving average line and it acts as minor support or resistance line. Sometimes the price will break the base line but then price will hold the conversion line.
If both MA lines are holding the price trend, then you need to trade in the direction of the trend and need to hold the position.
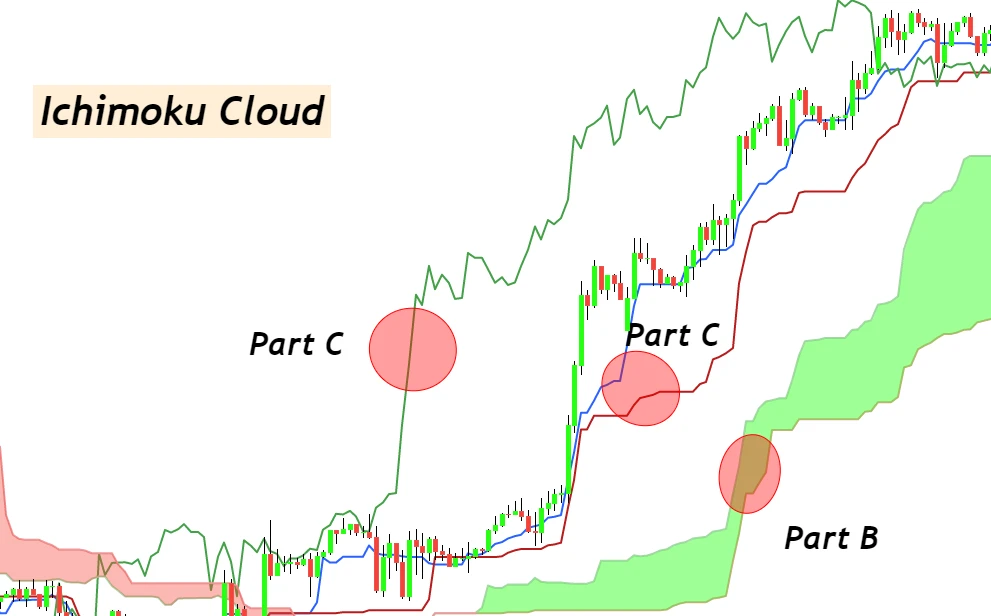
Part B
This part includes a working guide of leading line A and leading line B. we have already explained that these two lines act as boundary lines of cloud.
The color of the cloud represents the trend. Red color means bearish trend and green color means bullish trend. You can also change the color of the cloud in the settings of the indicator.
This cloud act as a confirmation of trend continuation or trend reversal. After the breakout of the cloud, trend reversal will happen.
Part C
This part includes the lagging line that lags 26 candlesticks with respect to the current candlestick. This is also a confirmation line. The span of this line must be larger than the price.
How to trade using the Ichimoku cloud indicator?
Ichimoku cloud trading is a complete trading system. You don’t need to have other confluences to add to this system. Just need to learn minor price action like identifying a valid breakout of moving average.
This trading system is very simple and it can be used in a number of ways. We will explain the Ichimoku cloud trend continuation and trend breakout strategy. Follow the following rules to trade using this indicator.
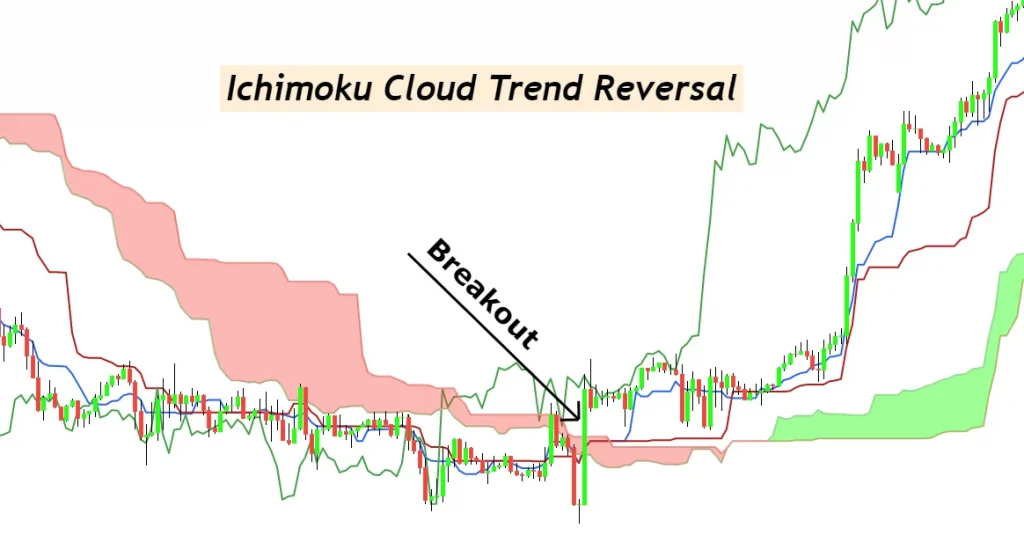
Trend Reversal using ichimoku cloud
- Identify a big candlestick breaching through the cloud, conversion line, and base line.
- Wait for the price to give a minor pullback and let the price bounce from the conversion line or base line.
- Place a trade after bouncing from conversion or base line in the direction of the breakout. The cloud must indicate the trend in the direction of the breakout. The span of price and lagging line also must be large.
- Pro Tip: To confirm the bounce from conversion or base line, you should look for a candlestick pattern at the moving average line that must reject.
- Hold the trade until the conversion or base line keeps on holding the price trend. After the breakout of conversion or base line, close the trade.
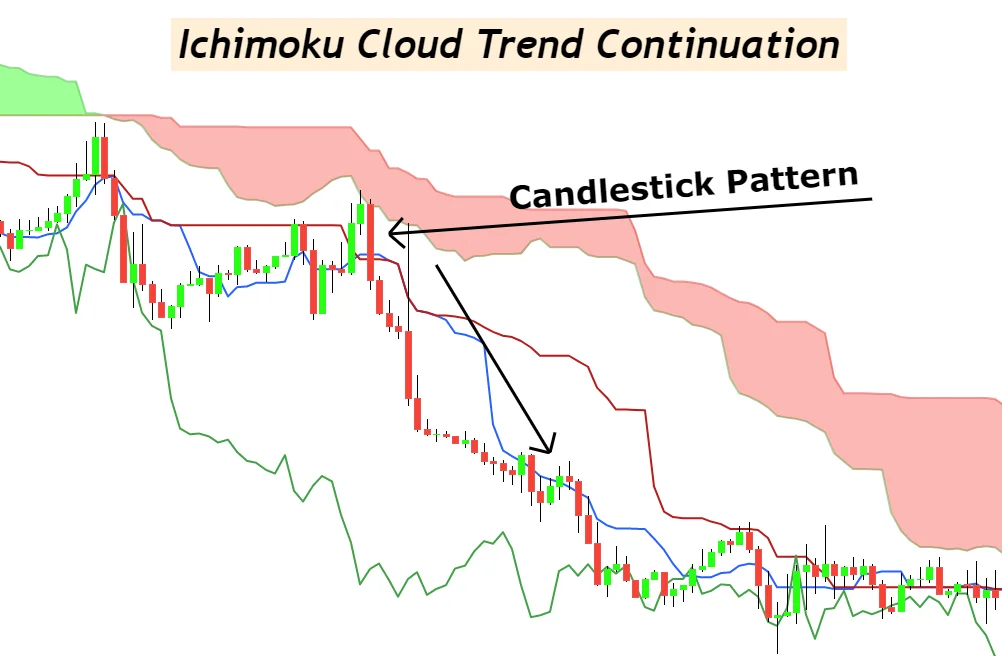
Trend Continuation using ichimoku cloud
Ichimoku cloud indicator can also be used to trade with the trend. Follow the following steps to trade with the trend.
- For a buy setup, confirm that the price is moving above the cloud and the color of the cloud is green. The span of price and the lagging line must be greater.
- Wait for the price to bounce from the cloud in the direction of the bullish trend. Because Cloud acts as a strong support and resistance level.
- After bouncing from the cloud, the price must breach through the conversion and base line in the direction of the bullish trend.
- After the breakout, place a buy order and place stop loss below the last higher low.
- Hold the trade until the bearish breakout of the conversion line.
Pro Tip: Just like horizontal support and resistance zones, the Ichimoku cloud acts as a dynamic support and resistance zone. Cloud indicates the zone
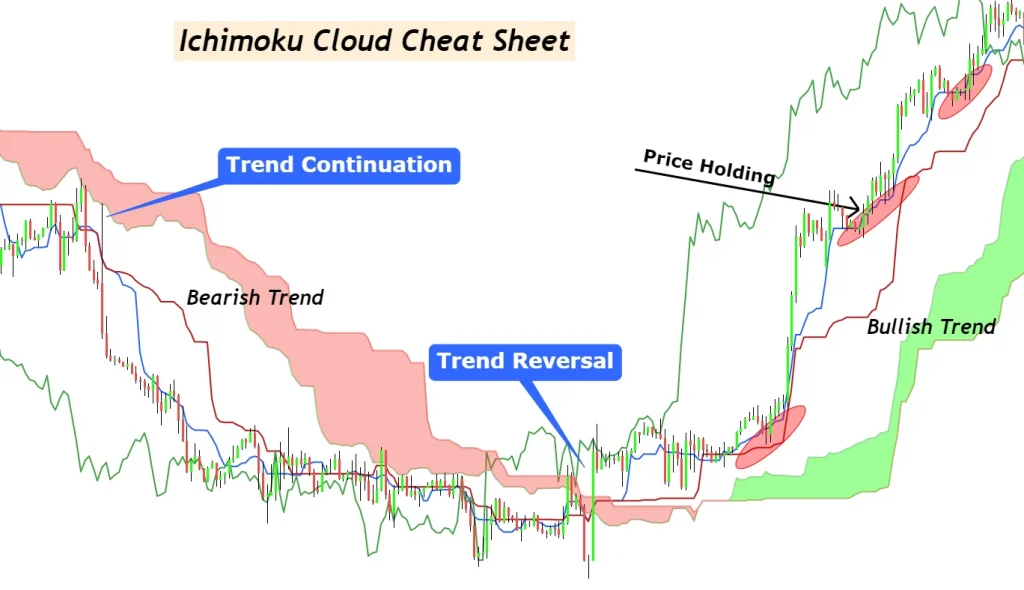
Ichimoku Cheat sheet
This cheat sheet includes an explanation of trend reversal and trend continuation trading systems. You need to open the trade until the price holds the base and conversion line. This method will improve the ability to hold a trade.
The Bottom line
Ichimoku cloud is an all one indicator. Everything has been taken into account and it is a complete trading system. If you will add other candlestick patterns then it will become a more profitable indicator. You can increase the accuracy by backtesting at least 100 times and adding more price pattern filters.