
Definition
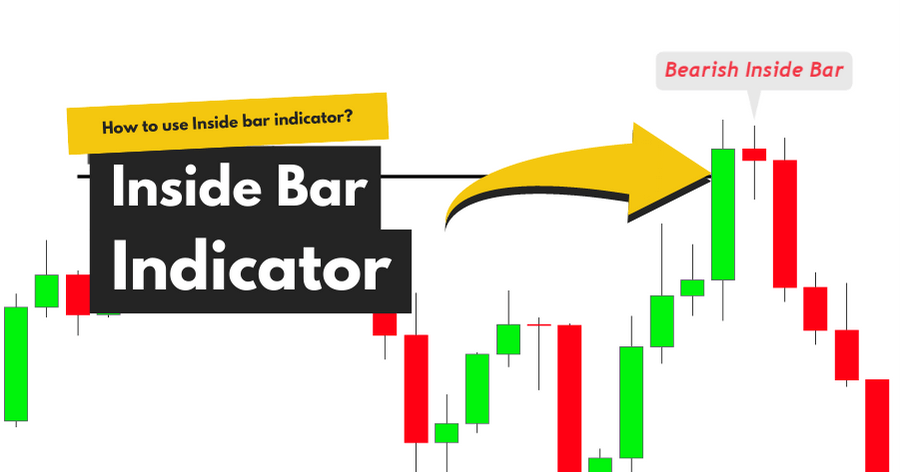
The inside bar indicator is a technical indicator that identifies the inside bar/harami candlestick pattern automatically on the candlestick chart. The inside bar is also named as harami candlestick pattern.
The inside bar candlestick is the most important pattern for trend-reversal traders. It helps to find the trend reversal of the market. Many retail traders use the harami candlestick pattern as an entry point. It also acts as a price Turning point.
In technical analysis, when market makers try to make big decisions, an inside bar candlestick pattern forms on the chart. It is a symbol of indecision in the market and shows the upcoming trend reversal.
How does the inside bar indicator work?
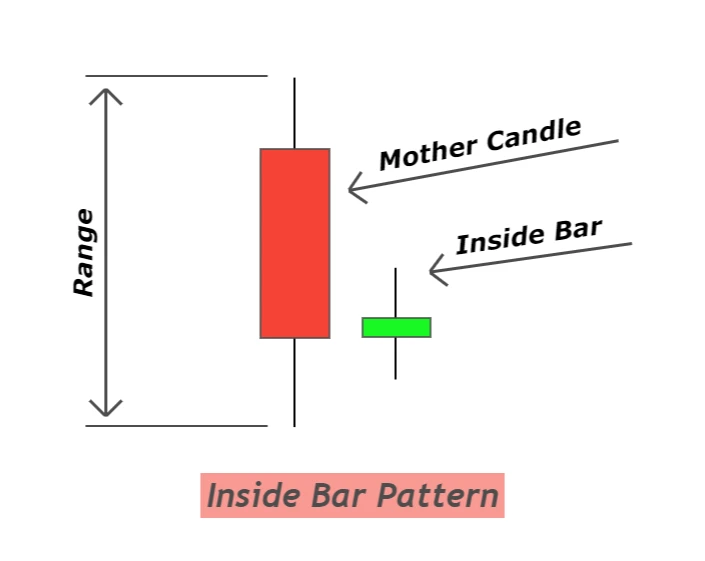
The inside bar indicator finds the combination of two candlesticks
- Mother candlestick
- Inside candlestick
After identifying these above two candlesticks, it will plot a label of the inside bar candlestick above/below the high/low, respectively.
Characteristics of high winning inside bar pattern
The above criteria are straightforward but insufficient to find a winning or high probability inside bar candlestick pattern. It must consist of the following characteristics to detect a high-probability pattern.
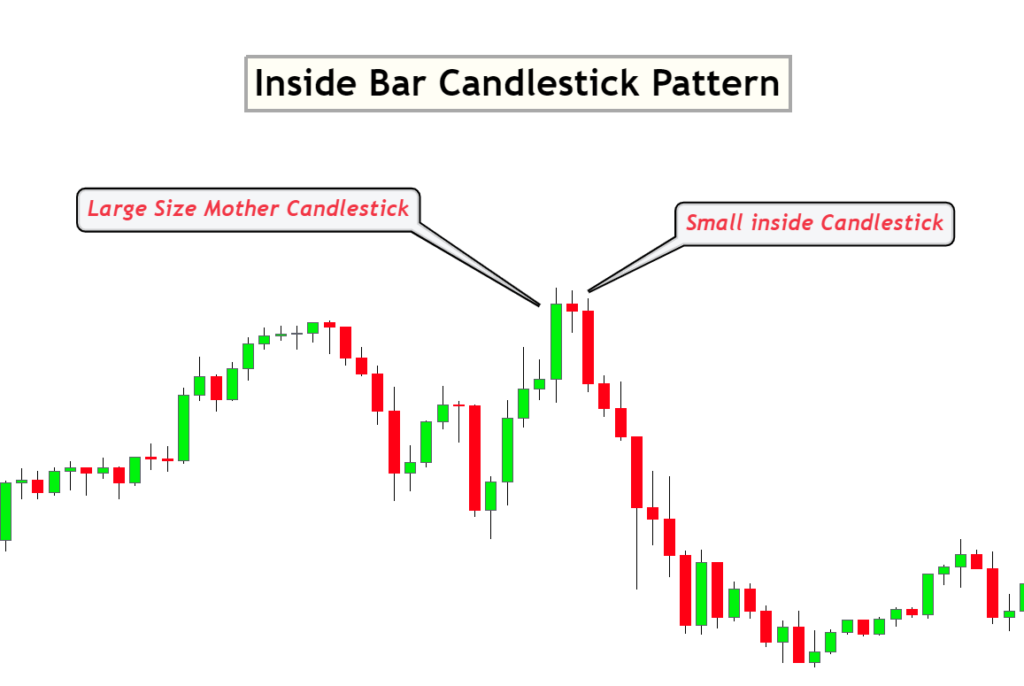
- The mother candlestick’s body should be large compared to a few previous candlesticks.
- The inside candlestick should be smaller in range as compared to the mother candlestick. It shouldn’t approach the size of a mother candlestick. Then the sense of pattern will change.
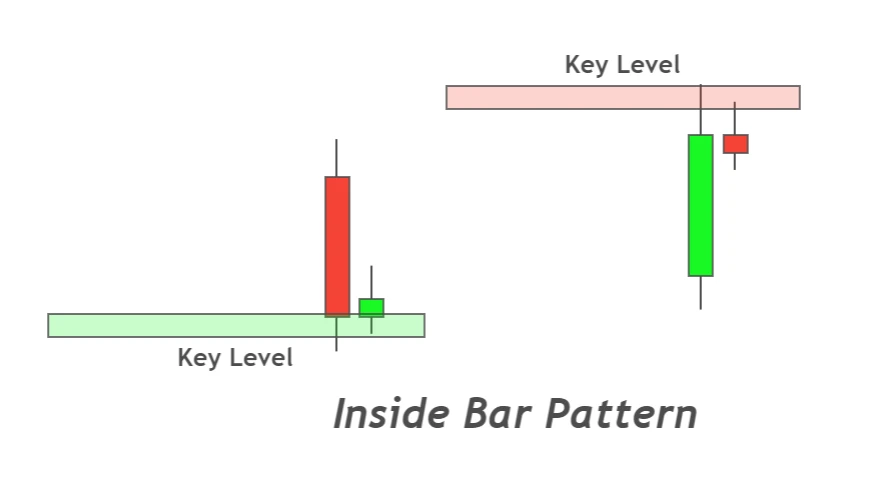
- The most important parameter is the mother candlestick’s location, which is at the false breakout. Mother candlestick must represent a false breakout of a key level. Then the chances of a trend reversal will increase.
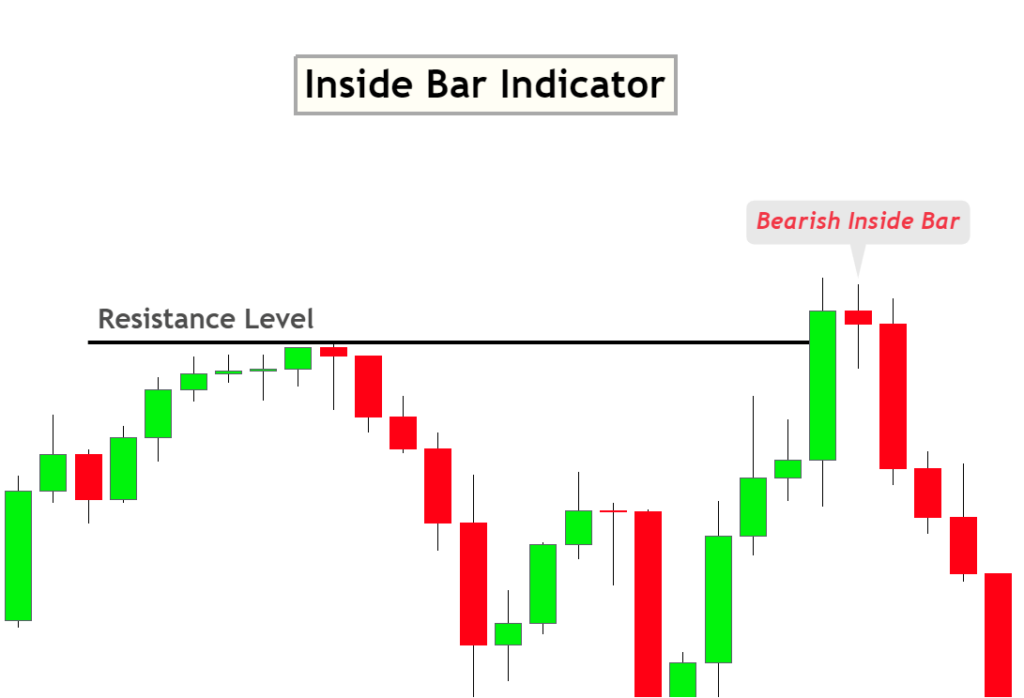
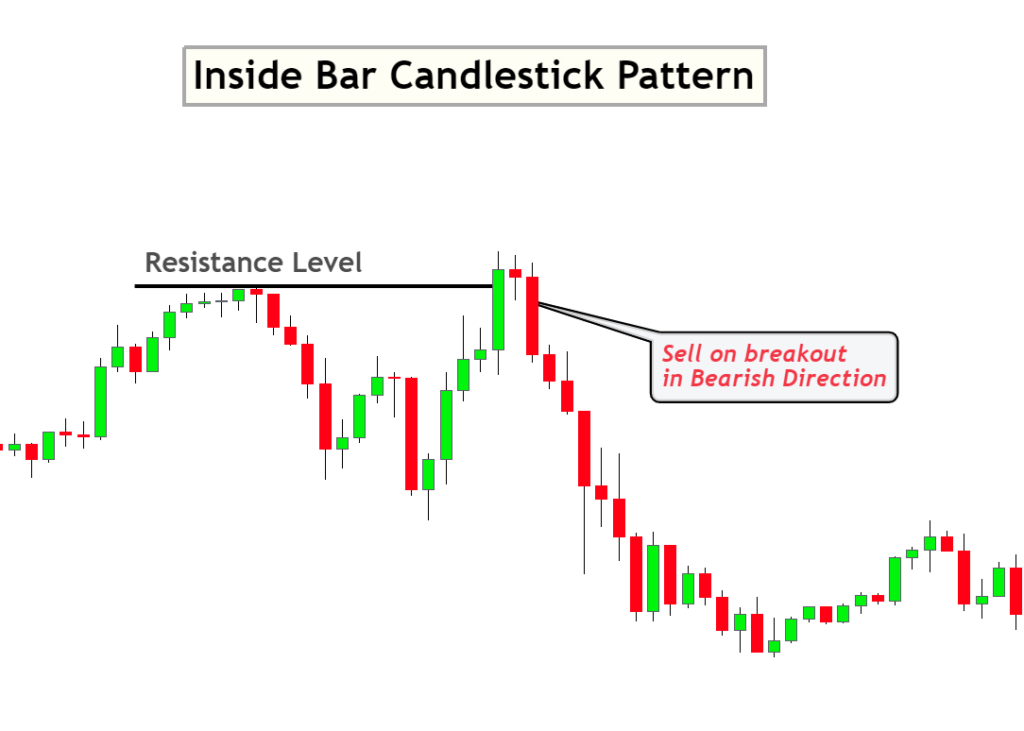
The breakout of the inside bar candlestick should be in the direction of a trend reversal. For example, if a harami or inside bar candlestick pattern forms after the resistance level break, the inside bar candlestick should break in the bearish direction. In case of a support level breakout, the inside bar candle should break in the bullish direction.
When you follow these four parameters, the chances of winning this candlestick pattern will increase. These parameters are necessary, and successful traders use the confluences in their trading strategies. Without confluences, the market noise will not let you become a profitable trader, and you’ll lose in trading.
We have also made an advanced candlestick patterns indicator with a candlestick patterns course. This candlestick pattern indicator is not ordinary but only identifies high-probability patterns.
How to trade with the inside bar indicator?
Here I have explained a simple trading strategy using the confluence of support or resistance zones with the inside bar indicator. It is also known as a false breakout trading strategy.
Open a buy trade
First, find an inside bar pattern at the break of support zone using the inside bar indicator. After this, wait for the break of the high of the inside candlestick and then open a buy trade. Place stop-loss a few pips below the swing low.
Open a sell trade
Identify the inside bar candlestick pattern at the break of the resistance zone using the indicator and wait for the breakout of the low of the inside candlestick. Then open a sell trade and place stop-loss a few pips above the swing high.
This is a simple and effective trading strategy. I have not told about the take profit levels because a candlestick does not reveal information about the trade exit. That’s why you should take help from other technical tools like Fibonacci, Renko charts and moving averages.
Does the inside bar candlestick act as a pin bar on a higher timeframe?
If you read the psychology of each candlestick pattern, you’ll learn a lot of advanced price action techniques.
For example, the inside bar pattern consists of two candlesticks on a 15M timeframe. So if you switch the timeframe to 30 minutes, you’ll most of the time see a pin bar candlestick. This is an exciting phenomenon; you can utilize it in advance price action trading.
The bottom line
I don’t recommend fancy indicators to traders, but I recommend indicators based on price action. Because indicators can also save a lot of time, you can’t sit in front of the screen looking for an inside bar candlestick pattern. However, it will be good if an indicator alerts you once an inside bar pattern forms, and then you can check yourself to make a perfect decision. This will also improve your trading psychology.
You can get access to this indicator for free after enrolling in the candlestick patterns course.
Great article! I’m a big fan of the inside bar candlestick pattern. It can be a great indicator of price consolidation and potential reversals. I’m especially fond of using this signal when trading breakouts. Thanks for sharing your knowledge on this topic.