

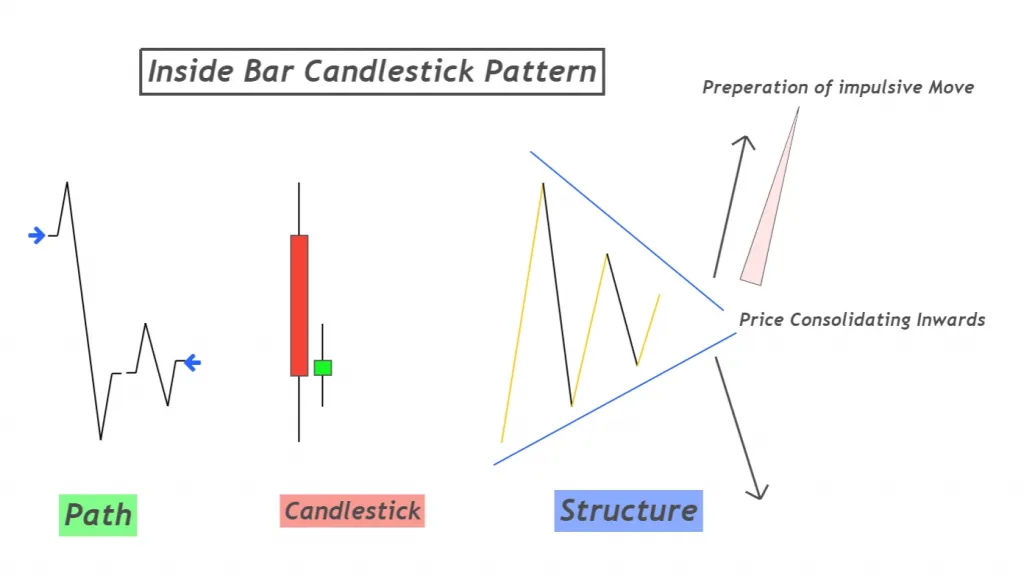
What is an inside bar pattern in forex?
Inside bar refers to a candlestick pattern that consists of two candlesticks in which the most recent candlestick will form within the range of the previous candle.
It is the most widely used candlestick pattern and there is a clear logic behind this pattern. It can make you a profitable trader if you will use it in the correct way.
How to recognize inside bar pattern
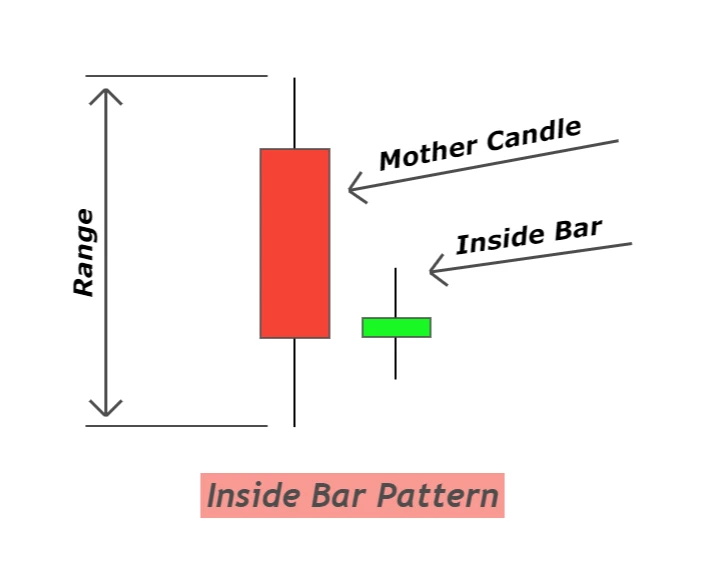
In the inside bar candlestick pattern, the second last candle is named as mother candle and the recent candle is named as inside bar candle. The high and low of inside bar candlestick will be within the range of high and low of mother candlestick.
- Mother candlestick (MB)
- Inside bar candlestick (IB)
Inside bar candlestick: Information Table
| Features | Explanation |
|---|---|
| Number of Candlesticks | 2 |
| Prediction | trend reversal/continuation |
| Prior Trend | N/A |
What does inside bar candlestick tell traders
Inside candlestick pattern represents indecision in the markets. It is a great sign of reversal or continuation of the trend in the forex market.
When inside bar forms after an impulsive wave then it wants to convey a message to traders that the market is deciding its future direction either to go up or down. Breakout of the inside bar tells us the future direction of the market that big traders or institutions have decided.
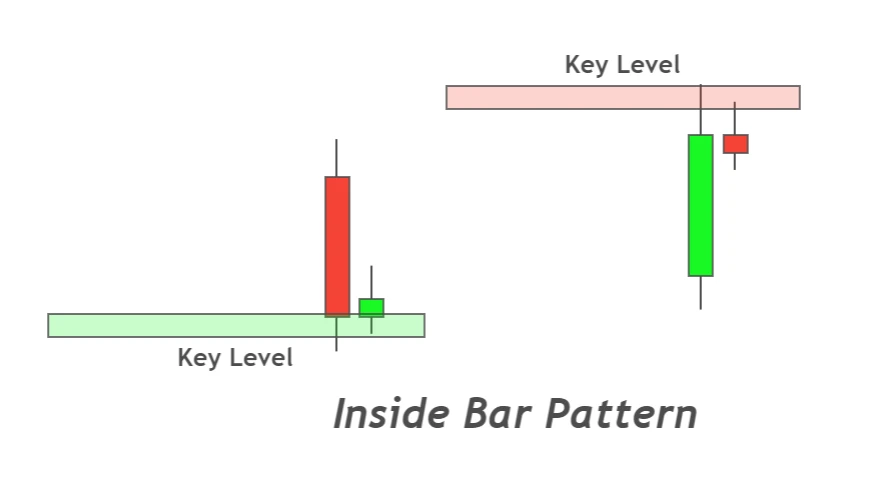
Let me show you the structure of the inside bar pattern. It clearly shows us the indecision because the market is moving inward. The size of every next wave will be shorter than the previous wave. It is also an indication of the upcoming storm in the market.
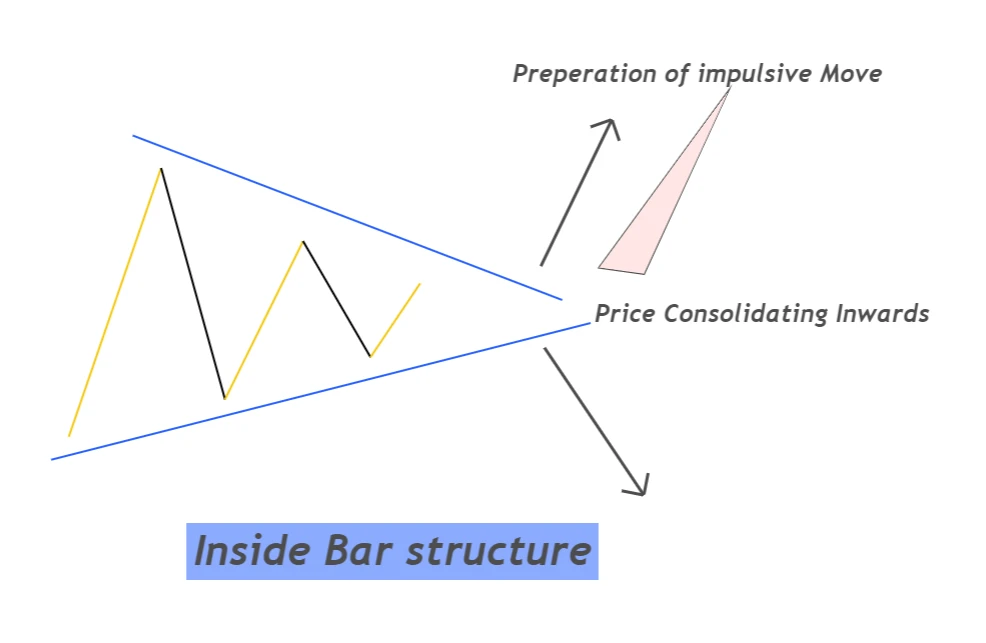
It is natural that It’s the calm before a storm
Characteristics of best inside bar pattern
The inside bar forms a lot of times daily on the chart of different currency pairs. But does every inside bar pattern is useful? Absolutely not!
There are certain parameters/criteria that filter out the best inside bars from the crowd. If the inside bar pattern meets those criteria, then it will give you a winning trade. The main criterion is the location of the inside bar pattern. If inside bar forms within a ranging market structure, then it will surely not work because it does not make any sense of trend reversal.
Inside bar location on chart
- Key levels (support/resistance levels)
- Fake out level (inside bar formation after faking out in the market)
- Trend lines (after trend line breakout)
- Moving average (formation of inside bar after moving average breakout)
Is inside bar a bullish or bearish pattern?
The inside bar pattern is neither a bullish pattern nor a bearish pattern. Breakout of inside bar candlestick decides the future direction of the market.
In simple words, we can say
- if high of inside bar candlestick breaks, then the market will stay bullish
- if low of inside bar candlestick breaks, then the market will stay bearish

Find High Probability Trades with this ADVANCED Candlestick Patterns Course
The Ultimate Candlestick Patterns Course That Will Help You To Trade Better
How to trade inside bar pattern
A combination of the inside bar and moving average breakout makes a perfect breakout trading strategy.
Because moving average breakout already indicates a reversal in the trend of a specific currency pair. Now if an inside bar forms just after the MA breakout, then it indicates the decision zone. Price is deciding either to reverse the trend completely or come back inside the MA to continue its previous trend.
Here you will have to understand two confluences. For example, if moving average breakout happens in a bearish direction and inside bar, breakout happens in a bullish direction, then both confluences are against each other. So, we will prefer to skip this.
We want them to break in the same direction. For example, if moving average breakout happens in a bearish direction then inside breakout must happen in a bearish direction. I hope it makes sense to you.
This setup increases the probability of reversal in trend after inside bar breakout.
Inside bar breakout strategy
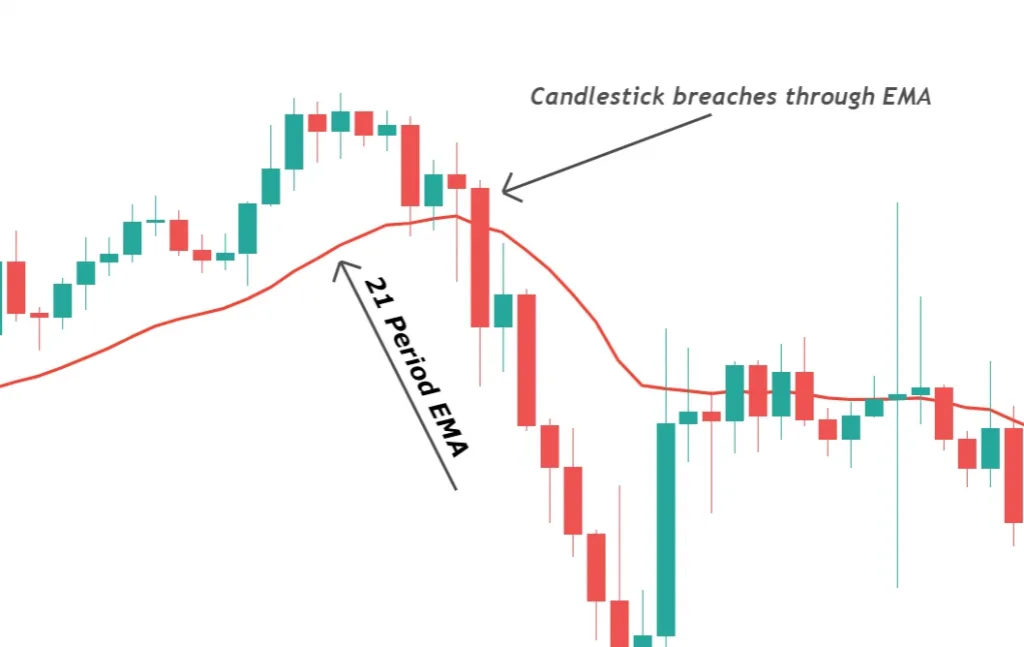
When a Big candlestick breaches through the moving average line and closes on the other side of the MA line then it is called a moving average breakout.
Remember candlestick must have a big body ratio.
The inside bar breakout means the break of high or low of inside bar candlestick.
Follow the following three steps in a sequence to find a trade setup
- Exponential moving average line (21 period)
- Breakout of EMA with a big candlestick (avoid Doji candlestick at breakout level)
- Identify inside bar formation after EMA breakout
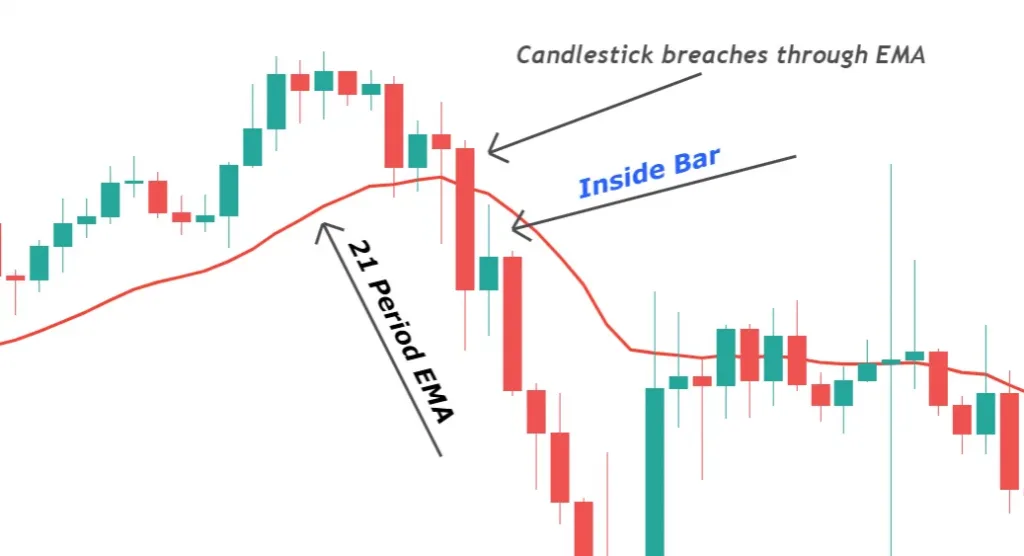
After identification of a trade setup, the breakout of the inside bar will decide either to trade that setup or skip that setup.
Sell trade setup
In the sell trade setup, the inside bar breaks in the direction of bears. Low of inside bar breaks just after its formation.
Place pending sell (sell stop order) order below the low of the inside bar. If the high of the inside bar breaks before the low point, then you must delete the sell stop order immediately. We will only sell in inside bar sell setup.
The Stop-loss level will be a few pips above the high of the inside bar. Remember to include spread while adjusting stop loss.
Take profit level is calculated by using Fibonacci extension tool in inside bar trading strategy. In the tradingview platform, use the trend-based Fibonacci extension tool. Drag the tool from the high of the big candlestick to the low point and then connect the third point to the high of the inside bar.
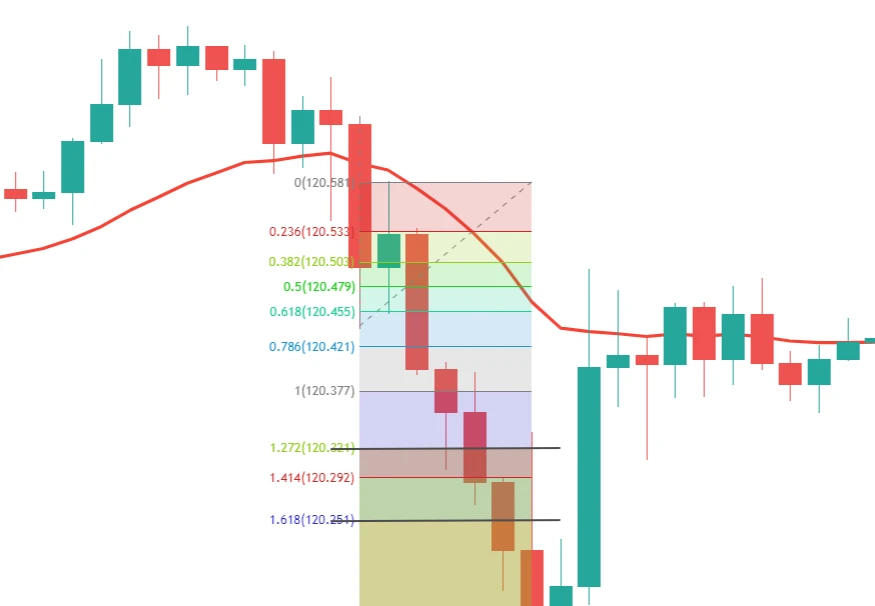
There are two take profit levels
- 1.272 Fibonacci extension level
- 1.618 Fibonacci extension level
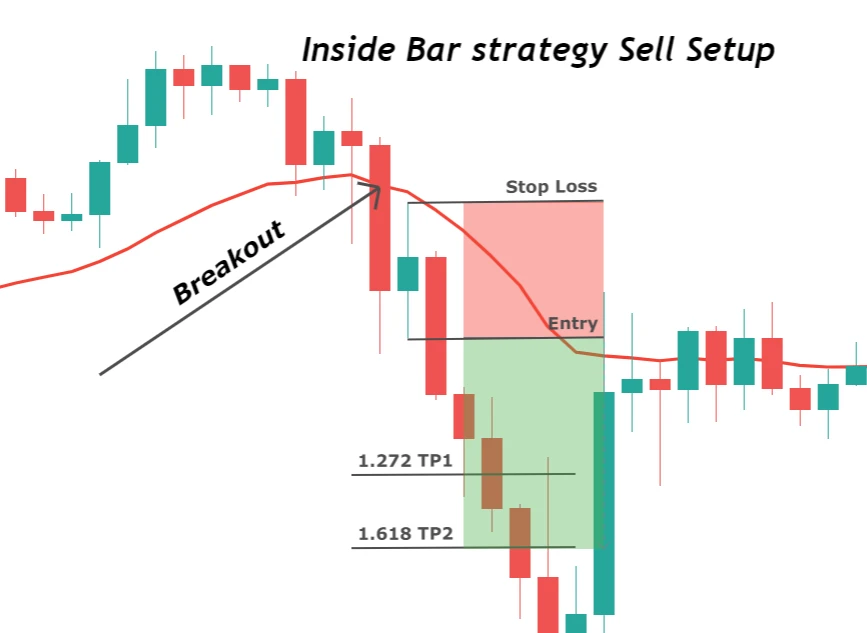
This is a simple inside bar breakout sell trade setup.
Buy trade setup
This is the opposite of a sell trade setup. Breakout of MA must be in the bullish direction.
Place buy stop order above the high of the inside bar. If the low of the inside bar breaks before the high, then we will immediately delete the pending order.
The Stop-loss level will be below the low of the inside bar.
Identify take profit levels using the Fibonacci extension tool. We will use only two take profit levels
- 1.272 Fibonacci extension level
- 1.618 Fibonacci extension level
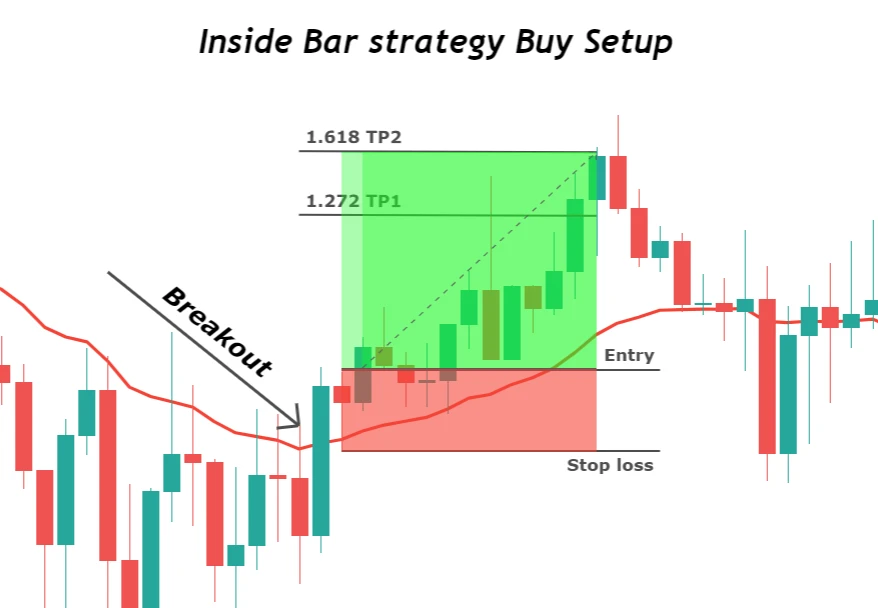
This is the best inside bar strategy based on pure price action.
Conclusion
The inside bar candlestick pattern is a natural pattern and it works, and it will continue working because this pattern reflects a natural pattern. So, try to understand this pattern’s psychology and trade it.
I will explain the top 3 advanced inside bar strategies using price action in the next article.
To make a trading strategy, first, understand the logic behind price action. If you do this, you will capture the best trades automatically by a single chart view.
FAQs
No, the colour of the inside bar candle does not make any difference. Because the inside bar represents indecision. Only the breakout of the inside bar decides the direction of the market.
The daily timeframe is the best to trade inside bar patterns. However, you can trade the inside bar on 30M or any timeframe above 30M.
Thanks alot bro
Your guidance is straight forward.
Article plus the video is near perfect